
Network connections
Figure 294: Basic Settings > Dashboard > Network connections
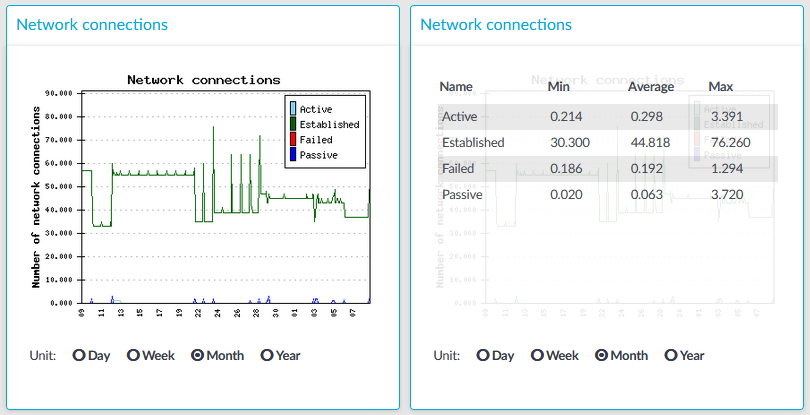
The Network connetion module on the Dashboard is based on the output of the netstat -s command. This command generates statistical information from all interfaces of all TCP connections. This means that in addition to the high-level proxy-service protocols (SSH, RDP, VNC, ICA, and so on), but all types of TCP connections are counted as well. The standard Munin plugins query this information and then it is displayed on the GUI. The graph itself displays the TCP activity of all network interfaces combined.
Statistics
The connection types displayed can be the following:
-
Active: The number of active TCP openings per second.
-
Established: The number of currently open connections.
-
Failed: The number of failed TCP connection attempts per second.
-
Passive: The number of passive TCP openings per second.
-
Resets: The number of TCP connection resets.
The Min, Average and Max values are displayed as a whole number if the value is constant for the statistics interval (the statistics are stored every 5 minutes). If minor changes occur in the actual values (for example, new connections are established), these changes can be displayed as fractions.
To determine the maximum values that the system can handle, consider the following:
-
The type of machine that you run One Identity Safeguard for Privileged Sessions (SPS) on.
-
The type of connections that are established and the content of these connections. For example:
-
If the users of RDP or ICA connections are watching videos, that can greatly reduce the amount of parallel connections that can pass through without experiencing speed reduction.
-
If the users mostly generate text-based content (for example, Excel, Word), then more connections can be used.
-
If a connection is not used actively, then it has minimal impact on SPS: only the memory allocation remains. In case of RDP, if the RDP client window is minimized, there is no network traffic at all.
-
Interface
Figure 295: Basic Settings > Dashboard > Interface
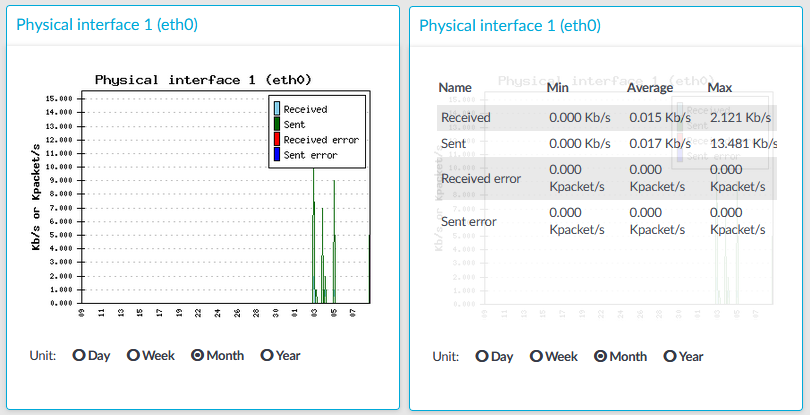
The Interface module on the Dashboard is based on data provided by the Linux kernel (/proc and /sys directories). The standard Munin plugins query this information from these locations and they are displayed on the GUI.
Statistics
The memory types displayed are the following:
-
Received: The network interface has received x Kilobytes per second.
-
Sent: The network interface has sent x Kilobytes per second.
-
Received error: The amount of errors, packet drops, and collisions on the network interface (in Kilopackets per second).
-
Sent error: The amount of errors, packet drops, and collisions on the network interface (in Kilopackets per second).
Load average
Figure 296: Basic Settings > Dashboard > Load average
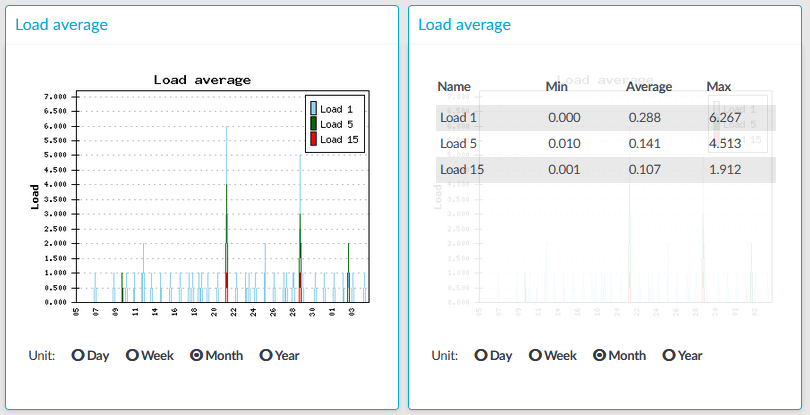
The Load average module on the Dashboard is based on data provided by the Linux kernel (/proc and /sys directories). The standard Munin plugins query this information from these locations and they are displayed on the GUI.
A measure of the amount of computational work that a computer system performs. The load average represents the average system load over a period of time. It conventionally appears in the form of three numbers which represent the system load during the last one-, five-, and fifteen-minute periods.
Statistics
The load average types displayed are the following:
-
Load 1: Average load in 1 minute.
-
Load 5: Average load in 5 minute.
-
Load 15: Average load in 15 minute.
Number of processes
Figure 297: Basic Settings > Dashboard > Number of processes
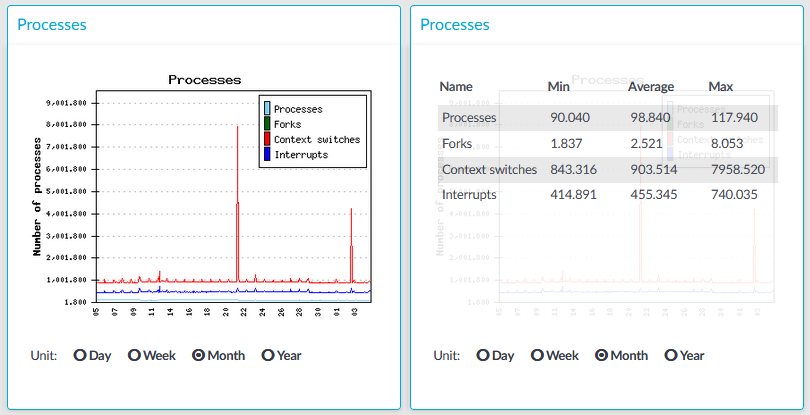
The Number of processes module on the Dashboard is based on the output of the ps command.
Statistics
The process types displayed are the following:
-
Processes: Number of running processes.
-
Forks: Number of forks (system calls). It is an operation where a process creates a copy of itself.
-
Context switches: Number of context switches. It is the switching of the CPU from one processor thread to another.
-
Interrupts: Number of interrupts.