Under Log > Sources > your-new-source > SQL > Monitoring you can customize your monitoring settings, including enabling Message rate alerting and customizing your Alerts, for your SQL type message source.
To customize the Monitoring settings for your SQL type message source
-
Navigate to Log > Sources > your-new-source > SQL > Monitoring.
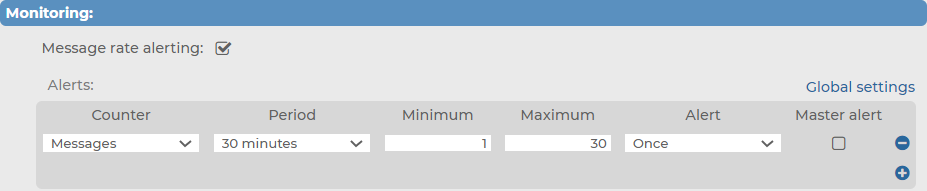
Figure 141: Log > Sources > your-new-source > SQL > Monitoring — Configuring the Monitoring settings for your SQL type message source
-
(Optional) Enable Message rate alerting.
-
Select the basis of your alerts under Counter.
-
Select the frequency of alerts (in minutes) under Period.
-
Specify the amount of alerts you want to receive within the specified Period (ranging between the minimum and maximum numbers of your choice) under Minimum and Maximum.
-
Select the alerting frequency in the Alert field.
Once sends only one alert (and after the problem is fixed, a "Fixed" message).
Always sends an alert each time the result of the measurement falls outside the preset range.
-
(Optional) To set the configured alert settings as your default, enable Master alert.
-
(Optional) To leave the Log > Sources > your-new-source > SQL > Monitoring page and customize Message rate alerting statistics settings that apply to the entire syslog-ng Store Box (SSB) appliance, clicking Global settings takes you to Log > Options > Message rate alerting statistics.
For more information about the configurable settings you can customize under Log > Options > Message rate alerting statistics, see Configuring message rate alerting.
NOTE: You can configure multiple alerts under Monitoring and pick the alert of your choice as your Master alert. To add a new alert under Message rate alerting, click  . To delete a redundant alert, click
  .
.
The syslog-ng Store Box (SSB) appliance can receive SNMP messages using the SNMPv2c protocol and convert these messages to syslog messages. SNMP messages are received using a special SNMP source that can be used in log paths like any other source. The following describes how to configure receiving SNMP messages.
To configure receiving SNMP messages
-
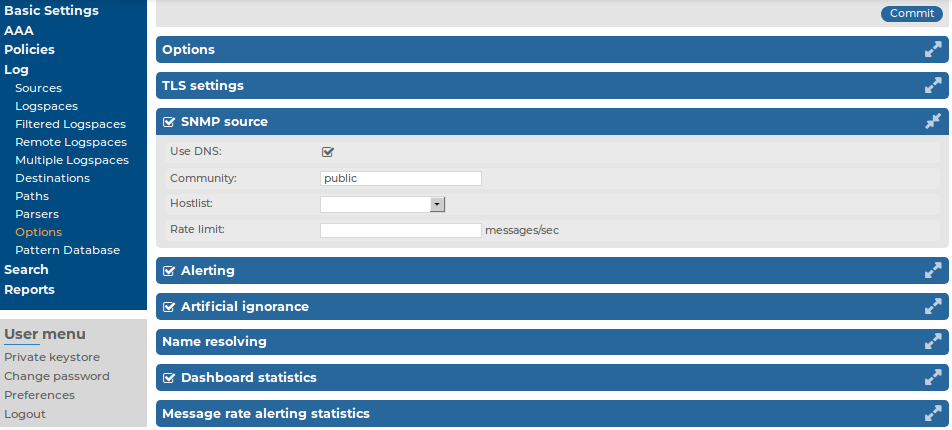
Navigate to Log > Options > SNMP source.
-
Ensure that the SNMP source option is enabled.
Figure 142: Log > Options > SNMP source — Receiving SNMP messages
-
The default community of the SNMP messages is public. Modify the Community field if your hosts use a different community.
NOTE: SSB can receive messages only from a single community.
-
To limit which hosts can send SNMP messages to SSB, create a hostlist policy, add the permitted hosts to the policy, and select the policy from the Hostlist field. For details on creating hostlists, see Creating hostlist policies.
-
To limit the rate of messages a host can send to SSB, enter the maximum number of packets (not messages) that SSB is allowed to accept from a single host into the Rate limit field. (This parameter sets the hashlimit parameter of the iptables packet filter that is applied to the source.)
|

|
Caution:
When rate limiting is enabled, and a host sends a large number of messages, SSB processes only the amount set in the Rate limit field. Any additional messages are dropped, and most probably lost. |
-
To use name resolution for SNMP messages, enable the Use DNS option.
-
Click  .
.
The syslog-ng Store Box (SSB) appliance stores log messages in binary or plain text log files called logspaces. You can define multiple logspaces, remote logspaces, and configure filtered subsets of each logspace.
Binary log files (logstores) correspond to the encrypted logstore() destination of syslog-ng. Logstores can be compressed, encrypted, and time stamped by an external Time Stamping Authority (TSA). To make the contents of the logstore searchable, you can create a separate indexer configuration for each logstore.
A multiple logspace aggregates messages from multiple SSBs (located at different sites), allowing you to view and search the logs of several SSBs from a single web interface without having to log on to several different interfaces.
Remote logspaces enable you to access and search logspaces (including filtered logspaces) on other SSB appliances.
Filtered logspaces allow you to create a smaller, filtered subset of the logs contained in an existing local, remote or multiple logspace. Assigning a user group to a filtered logspace enables fine-grained access control by creating a group that sees only a subset of the logs from a logspace.
Summary of multiple, remote, and filtered logspace types provides a summary and comparison of these three logspace types.
Table 7: Summary of multiple, remote, and filtered logspace types
| Multiple |
Multiple SSBs located at different sites |
Aggregate messages from multiple logspaces into a single logspace
Pre-filter log messages and share with only select user groups |
✔ |
✔ |
| Remote |
Remote SSB |
Access a logspace on another SSB |
✔ |
✔ |
| Filtered |
Local / multiple / remote SSB(s) |
Control access to a logspace at a granular level by granting access only to a subset of a logspace |
✔ |
N/A |
By default, SSB has the following logspaces:
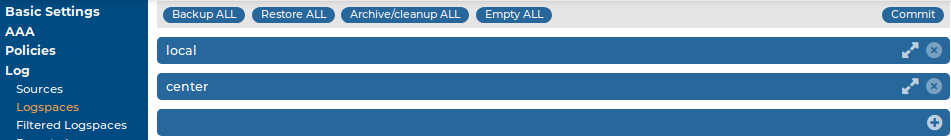
Figure 143: Log > Logspaces — Default logspaces in SSB
-
local: An unencrypted, binary logspace for storing the log messages of SSB.
-
center: An unencrypted, binary logspace for storing the log messages sent by the clients.
Logspaces are stored locally on the hard disk of SSB. To access a logspace remotely, you can configure another SSB to view and search the logspace as a remote logspace, or you can make the logspace accessible as a network drive.
Logstores are logspaces with binary log files for storing log messages sent by the clients. Logstores can be compressed, encrypted, and time stamped by an external Time Stamping Authority (TSA). To make the contents of the logstore searchable, you can create a separate indexer configuration for each logstore.
The following limitations apply to logstores:
-
Indexing logstore files is currently limited: the indexer can handle only one file from a logstore for every day (syslog-ng Store Box (SSB) automatically starts a new log file for every day).
-
Logstore files consist of chunks. In rare cases, if the syslog-ng application running on SSB crashes for some reason, it is possible that a chunk becomes broken. This means that it contains log messages, but the chunk was not finished completely. However, starting from SSB version 2 F1, the syslog-ng application running on SSB processes log messages into a journal file before writing them to the logstore file, reducing message loss even if an unexpected crash occurs.
Similarly, if the indexer application crashes for some reason, it may be possible that some parts of a logstore file are not indexed, and therefore the messages from this part of the file do not appear in search results. This does not mean that the messages are lost. Currently it is not possible to reindex a file.
