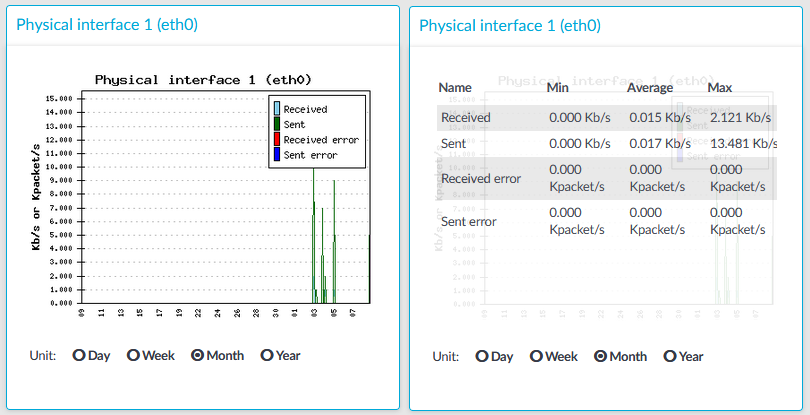
Figure 374: Basic Settings > Dashboard > Interface

The Interface module on the Dashboard is based on data provided by the Linux kernel (/proc and /sys directories). The standard Munin plugins query this information from these locations and they are displayed on the GUI.
Statistics
The memory types displayed are the following:
-
Received: The network interface has received x Kilobytes per second.
-
Sent: The network interface has sent x Kilobytes per second.
-
Received error: The amount of errors, packet drops, and collisions on the network interface (in Kilopackets per second).
-
Sent error: The amount of errors, packet drops, and collisions on the network interface (in Kilopackets per second).
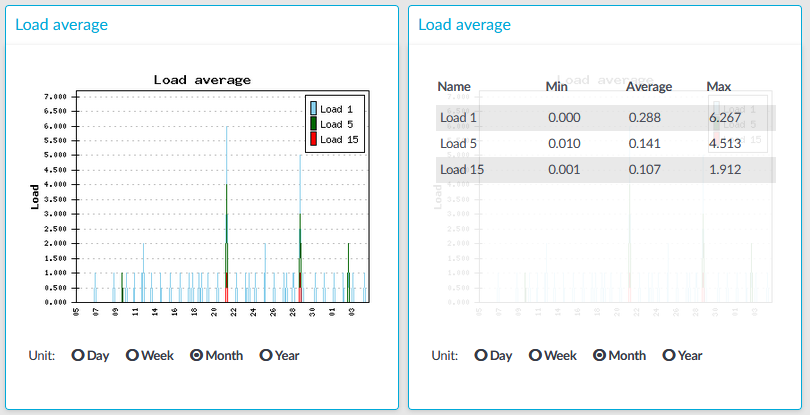
Figure 375: Basic Settings > Dashboard > Load average

The Load average module on the Dashboard is based on data provided by the Linux kernel (/proc and /sys directories). The standard Munin plugins query this information from these locations and they are displayed on the GUI.
A measure of the amount of computational work that a computer system performs. The load average represents the average system load over a period of time. It conventionally appears in the form of three numbers which represent the system load during the last one-, five-, and fifteen-minute periods.
Statistics
The load average types displayed are the following:
-
Load 1: Average load in 1 minute.
-
Load 5: Average load in 5 minute.
-
Load 15: Average load in 15 minute.
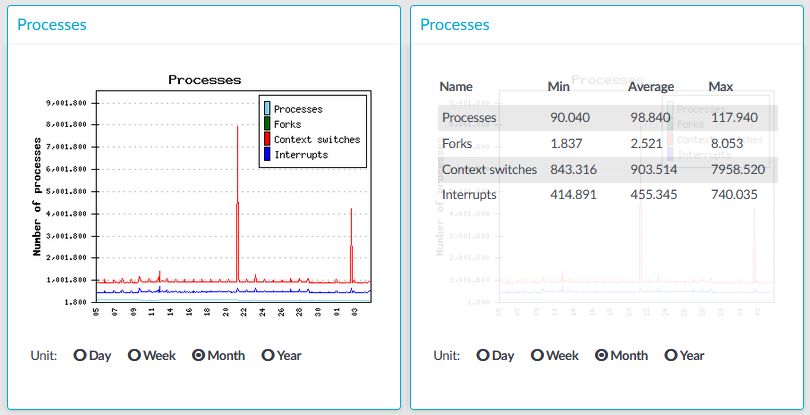
Figure 376: Basic Settings > Dashboard > Number of processes

The Number of processes module on the Dashboard is based on the output of the ps command.
Statistics
The process types displayed are the following:
-
Processes: Number of running processes.
-
Forks: Number of forks (system calls). It is an operation where a process creates a copy of itself.
-
Context switches: Number of context switches. It is the switching of the CPU from one processor thread to another.
-
Interrupts: Number of interrupts.
The following describes how to display statistics of a specific connection policy.
To display statistics of a specific connection policy
-
Navigate to Basic Settings > Dashboard > Connection statistics.
-
To display the statistics of a connection policy, enter the name of the policy into the Connection.
-
Select the time period to display from the Select resolution field.
-
Click View graph.


