Specify a time range to restrict, or filter your search criteria by setting boundaries on your searches. You can restrict the search to one of the preset time ranges, or use a custom time range for a more specific search.
When you specify a time range, the search result includes:
-
Connections started and finished anywhere between the start time and end time you specified.
-
Connections started anywhere between the start time and end time you specified.
-
Connections ended anywhere between the start time and end time you specified.
-
Active connections if they were started anywhere between the start time and the end time you specified.
For example, at 17:00 PM you specify a start date of 10:00 AM and end date of 15:00 PM for your search. The search result includes:
-
Connections started at 8:00 AM and ended at 14:00 PM.
-
Connections started at 11:00 AM and ended at 14:00 PM.
-
Connections started at 11:00 AM and ended at 16:00 PM.
-
Active connections started at 11:00 AM.
-
Active connections started at 10:00 AM.
To specify time ranges
-
To select the start date of your search, click Pick a date.
Alternatively, use the
(shortcuts) button to restrict the search to one of the preset time ranges. For example, to investigate an incident that occurred sometime in the last hour, you can select Today, but a better option is Last 60 minutes.
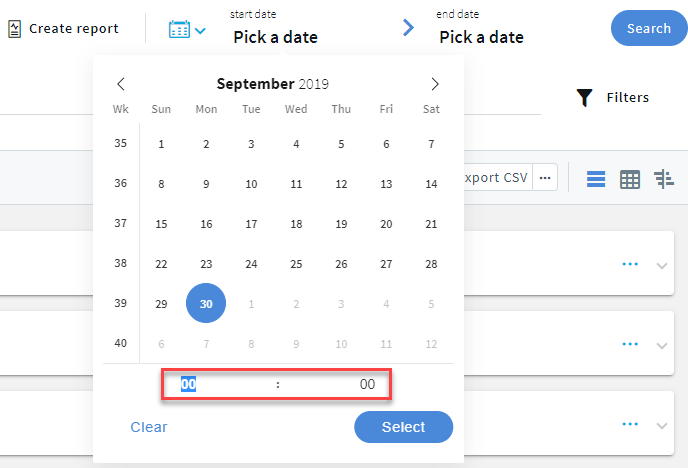
Figure 145: Sessions — Pick a date
-
From the calendar, select the start date as required.
NOTE: The date refers to the timezone configured on SPS.
-
For exact time ranges, specify to search by the hour and minute.
Figure 146: Sessions — Specify hour and minute
-
To select the end date of your search, click Pick a date and select a date as required.
If you specify only the start date, the end date is set to the current time.
-
Optional: To clear the start and end date, click
-
Optional: You can use the timeline for a quick time range selection and visual representation of sessions in the selected interval.
-
Click the
icon.
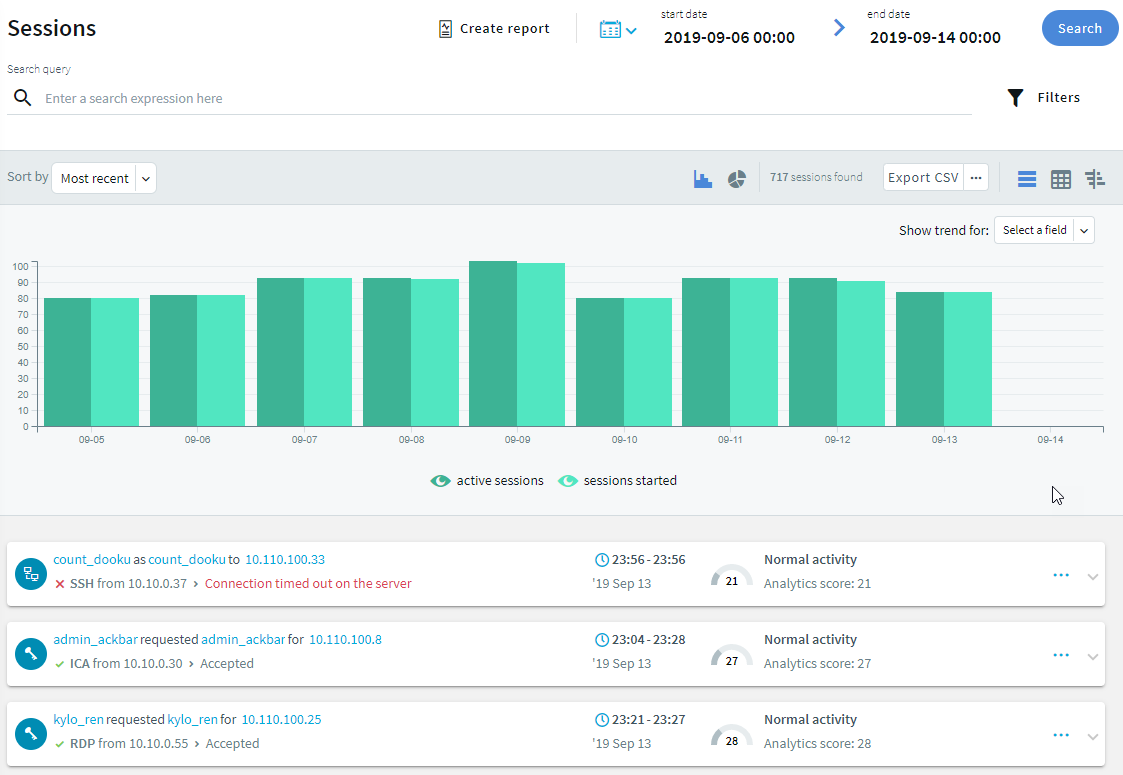
Figure 147: Sessions — Using the timeline
The bars display the number of results in the selected interval.
The active sessions columns indicate all the sessions, which were active in the selected interval. The sessions started columns indicate all the sessions started during the selected interval. For example, if the selected interval is today between 8:00 AM and 9:00 AM, then a session started at 7:00 AM but lasting after 8:00 AM is displayed in the active sessions column. A session started at 8:30 AM is displayed in the sessions started column. Since the session was active during the selected time interval, the session started at 8:30 AM is also displayed in the active sessions column.
To disable the active sessions and view only the started sessions in the timeline, click
. To disable the started sessions and view only the active sessions in the timeline, click
.
Hovering the mouse above a bar displays the number of entries and the start and end date of the period that the bar represents.
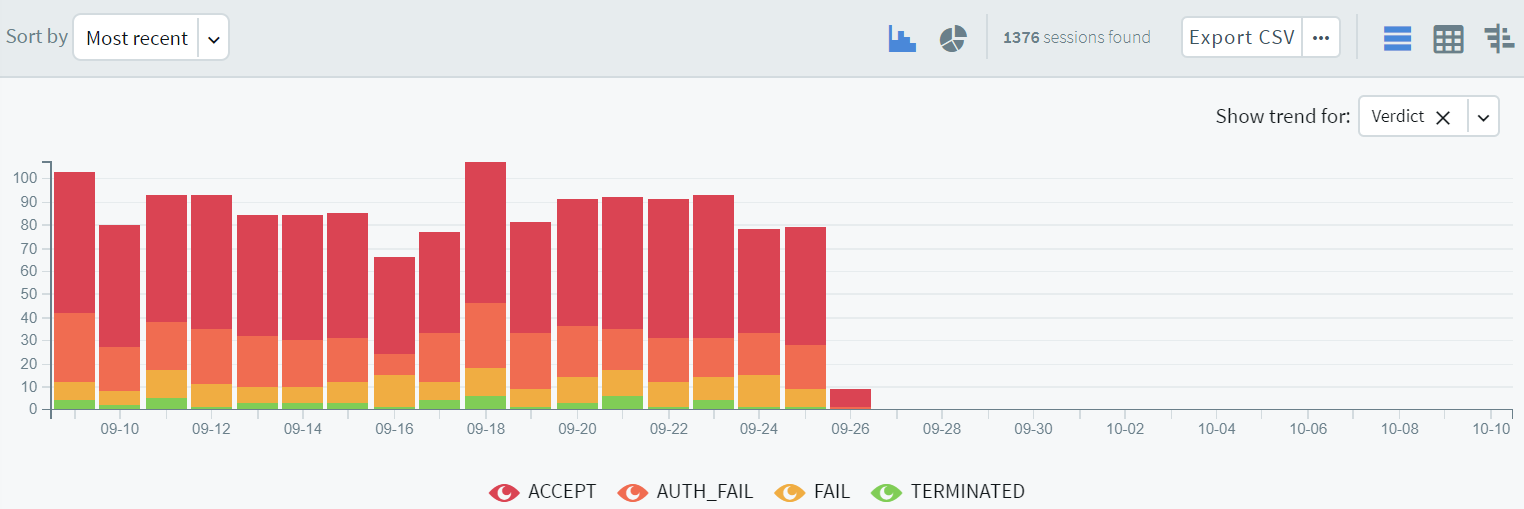
Trend analysis allows you to use the timeline to find changes over time. For example, to find the time range where terminated connections had a significant peak compared to other days, from the Show trend for drop-down menu, select Verdict. Note that you can only view trend analysis for Active, Analytics Score, Client name, Protocol, Server hostname, Server port, Server username, Username and Verdict. All the other selections are grayed out.
The colors of the bars in the timeline allow you to quickly find the time range with a higher number of terminated sessions.
Optional: To clear the trend analysis view, from the Show trend for drop-down menu, select X.
Figure 148: Sessions — Using the timeline - trend analysis
-
To select a range, drag the mouse pointer across the timeline or use Shift+Click and select multiple bars.
-