The syslog-ng Store Box (SSB) web interface can be accessed only using TLS encryption and strong cipher algorithms. The browser must support HTTPS connections, JavaScript, and cookies. Make sure that both JavaScript and cookies are enabled.
NOTE: SSB displays a warning message if your browser is not supported or JavaScript is disabled.
If you have successfully accessed the SSB web interface using HTTPS at least once, your browser will remember this, and on any subsequent occasions, it will force you to access SSB using HTTPS, even if you try loading it through an HTTP connection. This is thanks to the HTTP Strict Transport Security (HSTS) policy, which enables web servers to enforce web browsers to restrict communication with the server over an encrypted SSL/TLS connection for a set period. Web servers declare the HSTS policy using a special Strict-Transport-Security response header field.
This might, however, cause issues in any of the following cases:
-
When the SSL certificate of SSB's web interface has expired. In this case, any attempt to access the web interface using a secure connection will fail with an error message.
-
When you switch the trusted CA-signed certificate to a self-signed certificate for SSB's web interface. As per HSTS design, a self-signed certificate is not taken to have been issued by a trusted CA, therefore any secure connections to the SSB web interface will fail with an error message.
The resolution to the above-mentioned issues is to:
-
Remove the HSTS settings in your browser. This must be done locally, in a browser-specific way. For detailed instructions, consult the support site of the browser you are using.
OR
-
Upload a new certificate, using a different browser on a different machine. For detailed instructions on how to upload external certificates to SSB, see "Uploading external certificates to SSB" in the Administration Guide.
Supported browsers:
Mozilla Firefox 52 ESR
We also test SSB on the following, unsupported browsers. The features of SSB are available and usable on these browsers as well, but the look and feel might be different from the supported browsers. Internet Explorer 11, Microsoft Edge, and the currently available version of Mozilla Firefox and Google Chrome.
The syslog-ng Store Box(SSB) appliance has a search interface for browsing the collected log messages. You can choose the logspace, enter a search expression, specify the timeframe, and browse the results here.
This section walks you through the main parts of the search interface.
To access the search interface, navigate to Search > Logspaces.
Figure 1: Search > Logspaces — The log message search interface
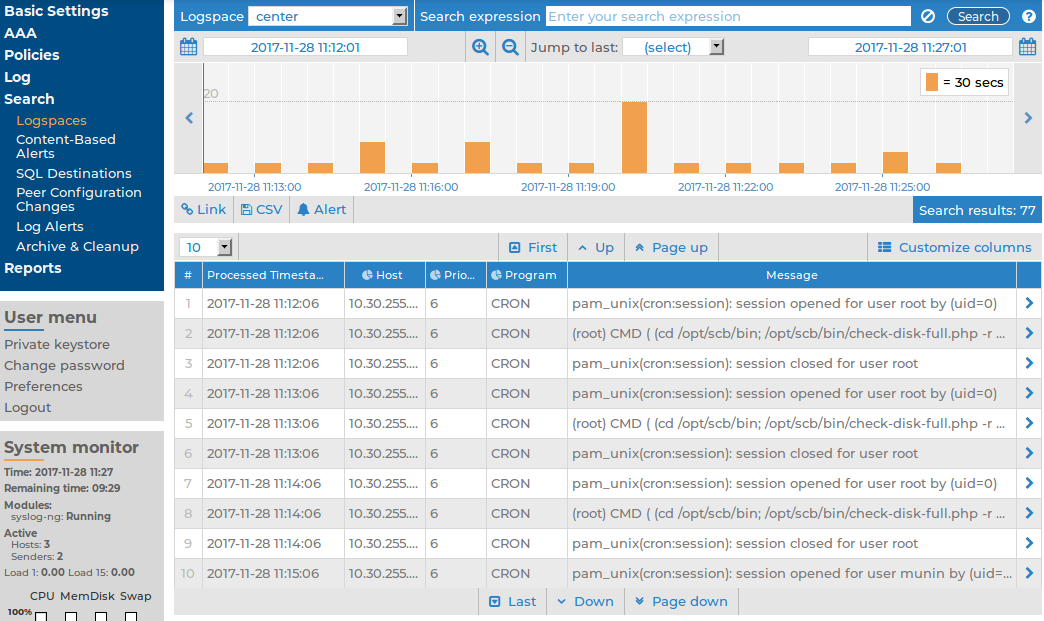
Logspaces:
To choose the appropriate logspace, use the Logspace name menu. Note that you cannot access plain text logspaces on the SSB search interface.
For more information on the available logspaces, and how to configure them, see "Storing messages on SSB" in the Administration Guide.
Search:
On the log message search interface, you can use the Search expression field to search the full list of log messages. Search expressions are case insensitive, with the exception of operators (like AND, OR, etc.), which must always be capitalized. Click the  icon, or see Using complex search queries for more details.
When searching log messages, the capabilities of the search engine depend on the delimiters used to index the particular logspace. For details on how to configure the delimiters used for indexing, see "Creating logstores" in the Administration Guide.
NOTE: You can search in indexed logspaces even if log traffic is disabled.
You can create complex searches using wildcards and boolean expressions. For more information and practical examples, see Using complex search queries.
NOTE: SSB only indexes the first 59 characters of every name-value pair (parameter). This has two consequences:
-
If the parameter is longer than 59 characters, an exact search might deliver multiple, imprecise results.
Consider the following example. If the parameter is:
.sdata.security.uid=2011-12-08T12:32:25.024+01:00-hostname-12345
SSB indexes it only as:
.sdata.security.uid=2011-12-08T12:32:25.024+01:00-hostname-
This corresponds to the first 59 characters. As a result, searching for:
nvpair:.sdata.security.uid=2011-12-08T12:32:25.024+01:00-hostname-12345
returns all log messages that contain:
.sdata.security.uid=2011-12-08T12:32:25.024+01:00-hostname-
-
Using wildcards might lead to the omission of certain messages from the search results.
Using the same example as above, searching for the value:
nvpair:*=2011-12-08T12:32:25.024+01:00-hostname-12345
does not return any results (as the 12345 part was not indexed). Instead, you have to search for:
nvpair:*=2011-12-08T12:32:25.024+01:00-hostname-*
This, as explained above, might find multiple results.
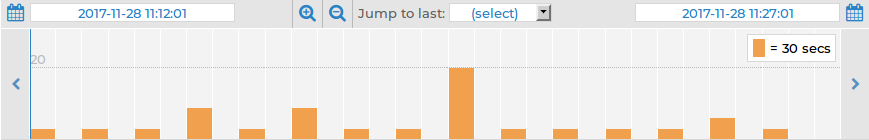
Overview:
Displays the number of log messages in the selected time interval.
Figure 2: Search > Logspaces — Log message overview
Use the  and
and  icons to zoom, and the arrows to display the previous or the next intervals. To change the timeframe, you can:
-
Change the beginning and the end date.
-
Click and drag the pointer across a period on the calendar bars to select a specific interval and zoom in.
-
Use the Jump to last option to select the last 15 minutes, hour, 6 hours, day, or week.
Hovering the mouse above a bar displays the number of results, and the start and end date of the period that the bar represents. Click a bar to display the results of that period in the table. Use Shift+Click to select multiple bars.
Action bar:
The search interface provides an action bar that allows you to:
It also displays the following information:
Figure 3: Search > Logspaces: Action bar

Link to a search query:
On clicking  , the Bookmark links panel is displayed:
Figure 4: Search > Logspaces — Bookmark links panel
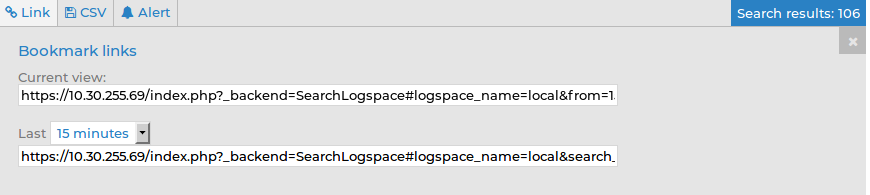
Bookmark links allow you to fetch a link to a search query so that you can:
-
Share your search queries with colleagues, who can then access the relevant search results in one click.
-
Save frequently used search queries as bookmark links.
The link in the Current view field provides a direct link to your search query and its results currently displayed on your screen. Whenever you open the bookmarked link from your browser, it will always return the same, fixed set of results. The start and end date that you set when executing the search query and fetching the link from the Bookmark links panel remain fixed.
The Last menu, on the other hand, allows you to specify an interval of time, for example, the last 15 minutes or the last hour, and fetch search results generated within that period. The search results that you access using this link may differ on two different occasions as the start point of the specified interval is always the moment you open the bookmarked link from your browser.
CSV export:
On clicking  , the CSV export panel is displayed:
Figure 5: Search > Logspaces — CSV export panel
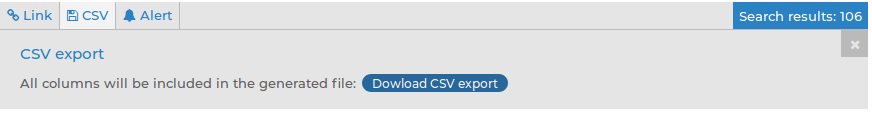
Clicking  exports your search results into a CSV file. This saves the table as a text file containing comma-separated values. Note that if an error occurs when exporting the data, the exported CSV file will include a line (usually as the last line of the file) starting with a zero and the details of the problem, for example, 0<description_of_the_error>.
Alert:
The alert functionality enables you to set up content-based alerts for search expressions of your choice. You will receive an alert when a match is found between the search expression and the contents of a log message. Note that the alerts are generated for only those log messages that are stored in the logspace(s) for which you set up the alert.
For detailed information on content-based alerts, see "Creating content-based alerts" in the Administration Guide.
Errors and warnings:
When any user action results in an error condition (for example, if you enter an invalid search expression, display statistics for a column that has not been indexed), an error or warning notification will be displayed on the action bar. Errors are shown in red letters, warnings are displayed in amber.
If there is more than one notification, the latest will be displayed and the number of notifications triggered will also be indicated. Clicking the notification will open an Errors and warnings panel:
Figure 6: Search > Logspaces — Errors and warnings panel
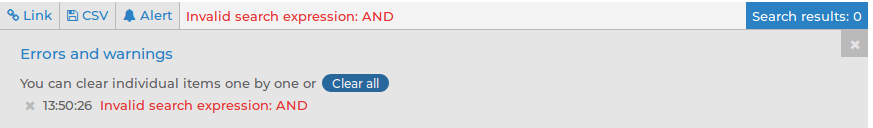
The Errors and warnings panel displays a list of errors/warnings with their time stamp and details of their cause.
You can clear notifications one by one by clicking  next to the them, or clear all of them by clicking
  .
.
Search results:
After running a search query, the action bar displays the number of search results returned by the query. This is useful information when you are trying to find out how often a certain element appears in the logs.
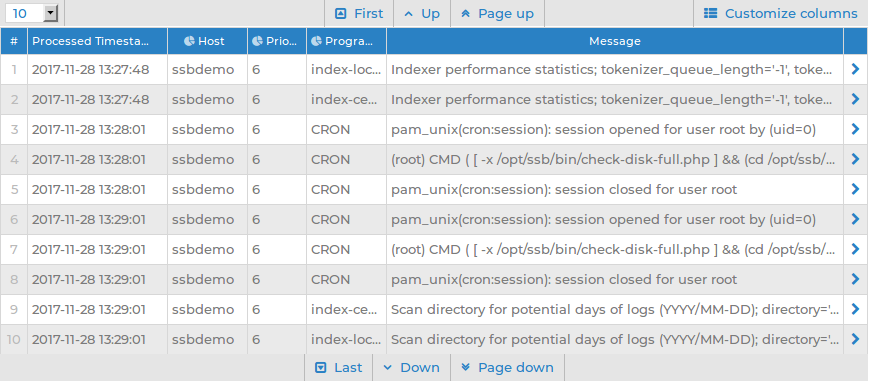
List of log messages:
Use the arrow keys and the Page Up and Page Down keys to navigate the listed log messages, or use the mouse wheel to scroll. You can disable mouse wheel scrolling in your User menu > Preferences. If data is too long to fit on one line, it is automatically wrapped and only the first line is displayed.
Figure 7: Search > Logspaces — List of log messages
Details of a log message:
To expand a row in the list of log messages, click  . The complete log message is displayed:
Figure 8: Search > Logspaces — Viewing a single log message
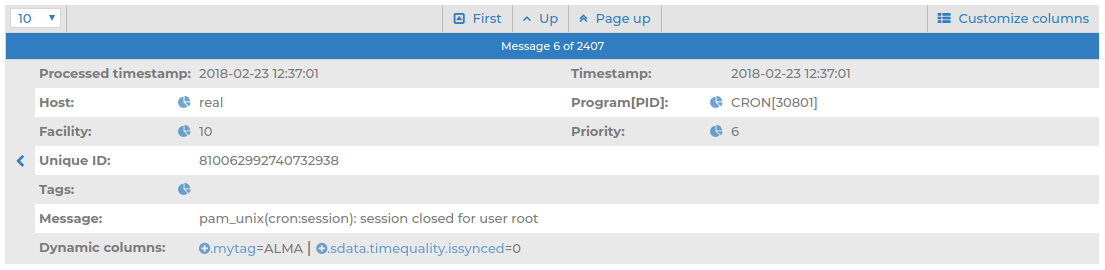
Use the arrow keys to jump to the previous or the next log message.
Use the Page Up and Page Down to jump to the 10th log message before or after the currently displayed log message. You can also jump to the previous or the next log message with the mouse wheel.
If the displayed log message consists of several pages of data, you can configure the mouse wheel to be able to use it for scrolling the message vertically. To do this, navigate to User menu > Preferences, deselect Mousewheel scrolling of search results and click Set options. This will disable jumping between log messages with the mouse wheel.
You can perform the following actions:
-
Click any word in the message to copy it to the Search field.
-
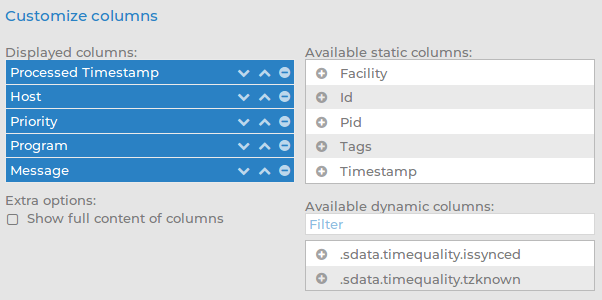
Click any of the dynamic columns (name-value pairs) to add it as a column to the list of log messages.
-
Click any of the  icons to view the statistics of the selected category.
To return to the list of all log messages, click  .
.


 .
. .
.