This section provides an overview of the Frequent Item Sets (FIS) flow view feature on the Search interface. It describes the underlying component (that is, the FIS algorithm), the elements of the FIS flow view visual, and possible scenarios (depending on your session details and pattern option choice).
From One Identity Safeguard for Privileged Sessions (SPS) version 6.2., a visual overview of Frequent Item Set (FIS) analysis is available on the Sessions interface. The FIS flow view is essentially similar to the flow view analytics overview, except that the FIS flow view only displays data narrowed down to a single user's previous sessions in the analysis period (which is the previous 90 days by default).
The component behind the analysis is the FIS algorithm, which examines multiple attributes of sessions and attempts to find values that frequently appear together, forming a set. Using this information, the algorithm can discover patterns in user behavior.
NOTE: For the FIS algorithm to be able to score a user's sessions, the user needs at least 1 FIS baseline built. Algorithm baselines (including the FIS baselines) are built automatically every day (usually during hours with less heavy traffic).
Elements of the FIS flow view
To access the FIS flow view feature, click on 
Figure 26: Sessions — The FIS flow view on the Analytics tab
Figure 27: Sessions — The FIS flow view (close-up)
The layout of the FIS flow view is similar to the attributes-grouped flow view, with the sessions forming a flow line (from here on referred to as a Connection). The relevant examined attributes (including the attribute nodes) are visible on the left hand side, while the irrelevant attributes (including the attribute nodes) are on the right hand side of the flow line visual.
The continuous line, with circles representing attribute nodes (that can be gray ( 


The different attribute node markings stand for:
Attributes
Similarly to the flow view, session data in the FIS flow view is grouped according to attributes (such as Protocol, Client name, Server hostname, Server port, and so on) that come from session data. The two attributes in the FIS flow view that do not come from session data as-is, but are further grouped instead:
-
Bucketed starting hour: the most frequently used session starting hours grouped into intervals of 3 hours each
-
Bucketed duration: the most frequently occurring session duration values, grouped into intervals of various length
NOTE: As a rule, the relevant attributes and attribute nodes (marked with
The FIS score gauge
The FIS score gauge (located in the upper right corner of the FIS flow view visual) indicates the FIS score of the selected session.
Figure 28: Sessions — The FIS score gauge
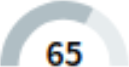
The FIS score is assigned to the session after the FIS algorithm analyzes it in comparison with the latest available baseline. If the session has a high amount of matches to the user's baseline, the FIS score's value will be low (indicating normal user behavior).
NOTE: The closer the FIS score gets to 100, the more it indicates unusual user behavior. For more information about normal and unusual user behavior, see Analyzing data using One Identity Safeguard for Privileged Analytics, Viewing session details, and the View session analytics step in Analyzing data using One Identity Safeguard for Privileged Analytics.
The value of the FIS score (also visible on the Sessions > Sessions list, as well as in the aggregated score summary, usually above the FIS flow line visual) is one of the several components of the session's aggregated score.
Figure 29: Sessions — The FIS score visible on Sessions > Sessions list

For more information about analytics algorithms and scores, see this section.
Pattern selection drop-down list
The pattern selection drop-down list (by default set to the Default option) offers the available patterns that the FIS algorithm generates after baseline analysis.
Figure 30: Sessions — The pattern selection drop-down list (set to the Default option)
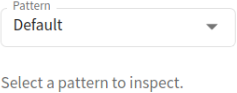
Figure 31: Sessions — The pattern selection drop-down list (further options)
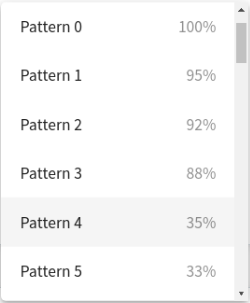
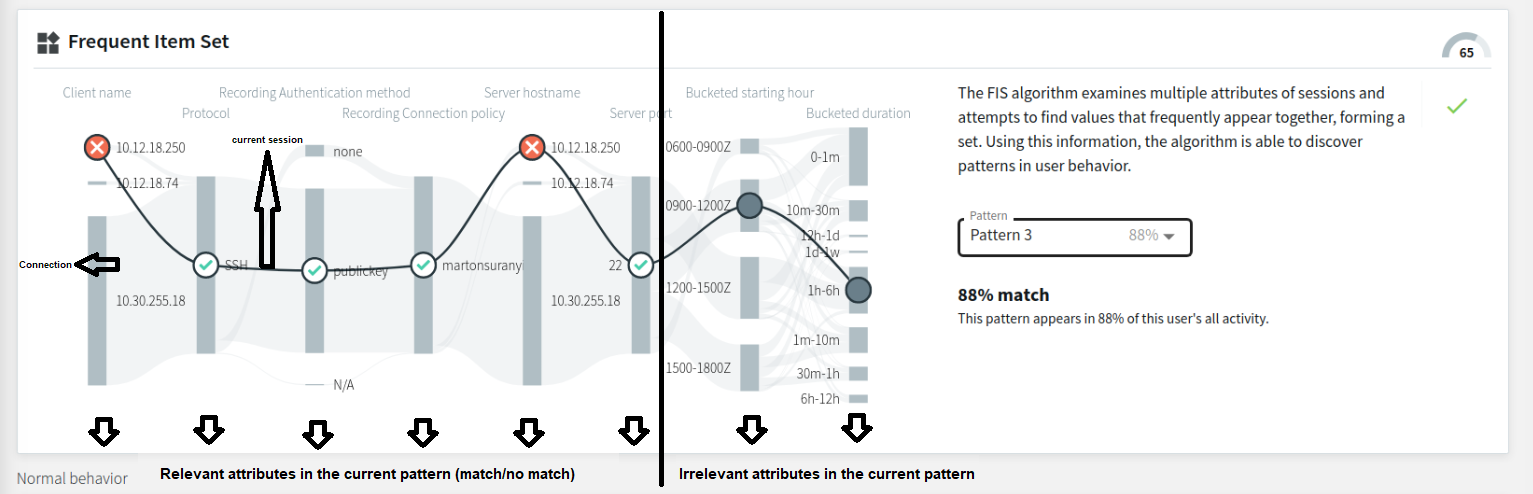
Depending on which available pattern option you select, the visual will display one of these cases:
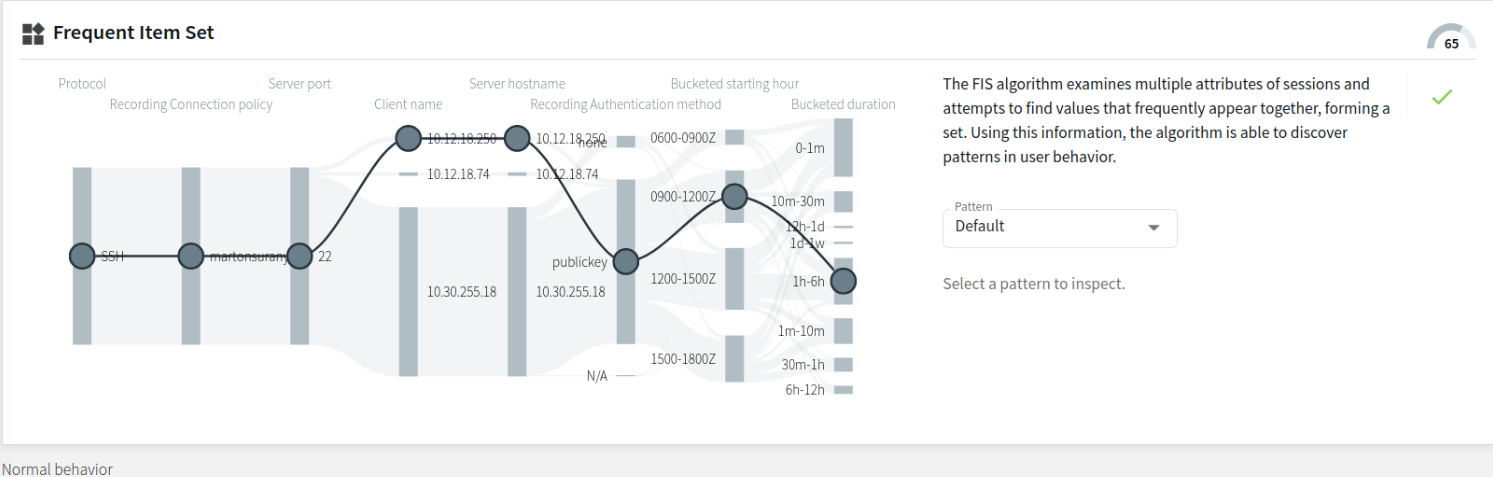
- The Default option
The Default option is the set of values that the FIS algorithm takes as a reference point. If you select the Default option, the flow line visual displays the user's previous sessions in the observed analysis period, with no patterns selected yet. The flow line visual below (set to the Default option) displays all possible attributes, marked with
Figure 32: Sessions — FIS flow view - the Default option (no patterns displayed yet)
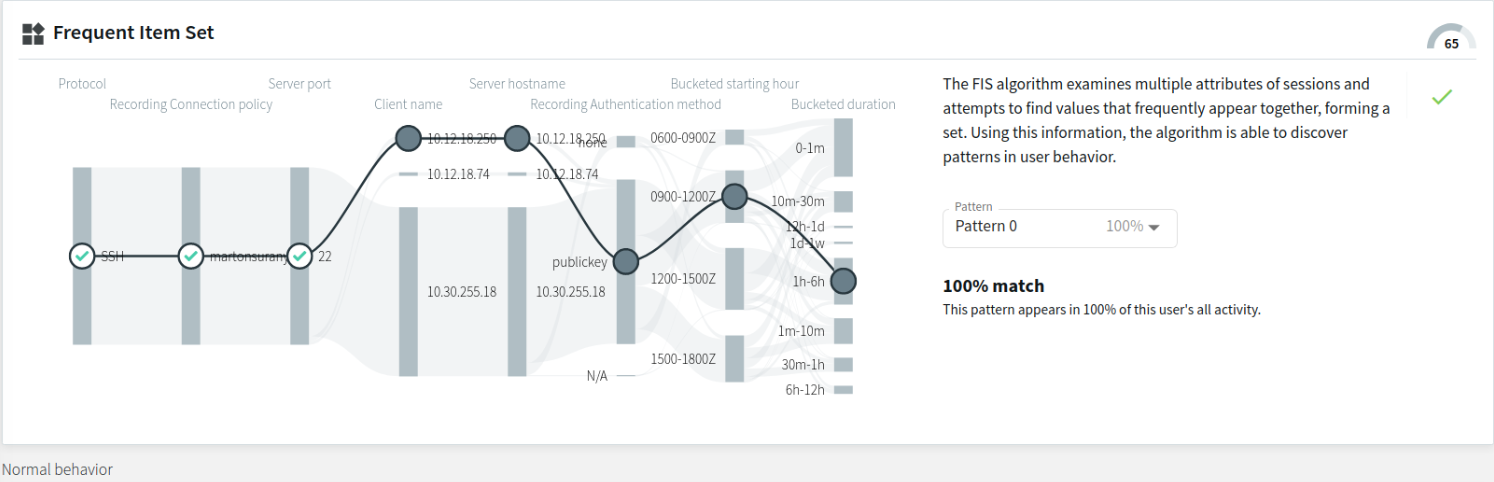
- Pattern with a 100% match to this user's sessions during the observed analysis period
The example below displays a pattern that appears in 100% of the user's previous sessions during the analysis period. As mentioned before, the relevant attribute nodes (marked with the
Figure 33: Sessions — FIS flow view - a pattern with a 100% match
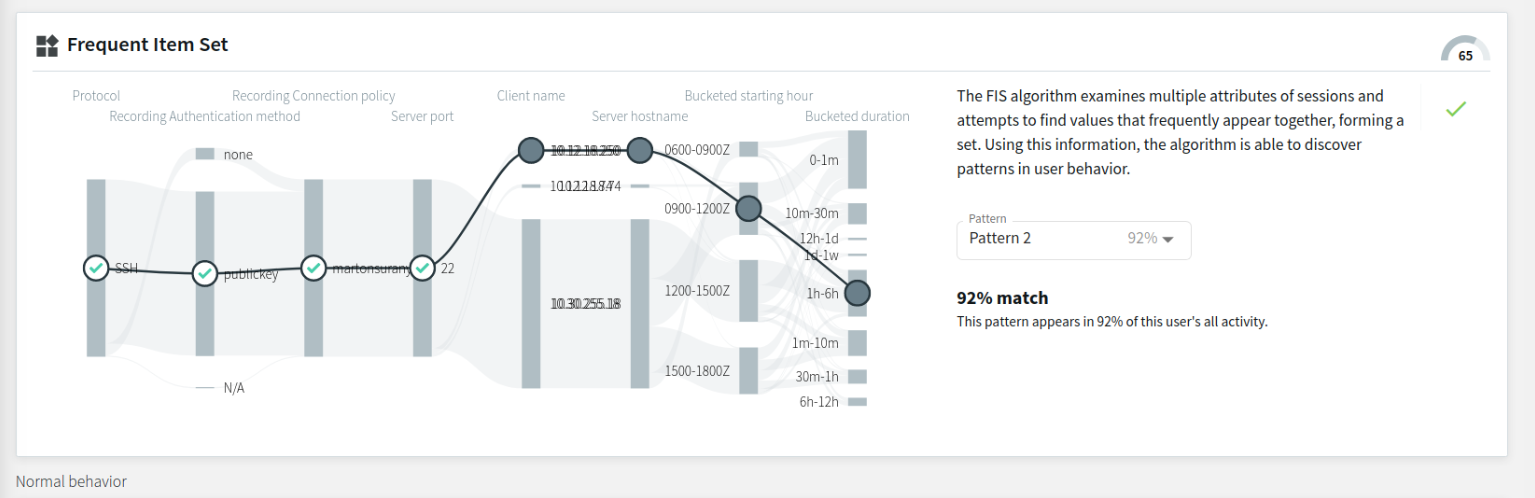
- Pattern with a high match percentage to this user's sessions during the observed analysis period
The example below displays a pattern that appears in 92% of the user's previous sessions during the observed analysis period. Similarly to the previous example, the relevant attribute nodes are arranged on the left-hand side, while the irrelevant ones are arranged on the right-hand side of the flow line visual. This example contains different relevant attribute nodes than the previous example, with 4 attribute matches to this particular pattern in this particular session.
Figure 34: Sessions — FIS flow view - a pattern with a high match percentage
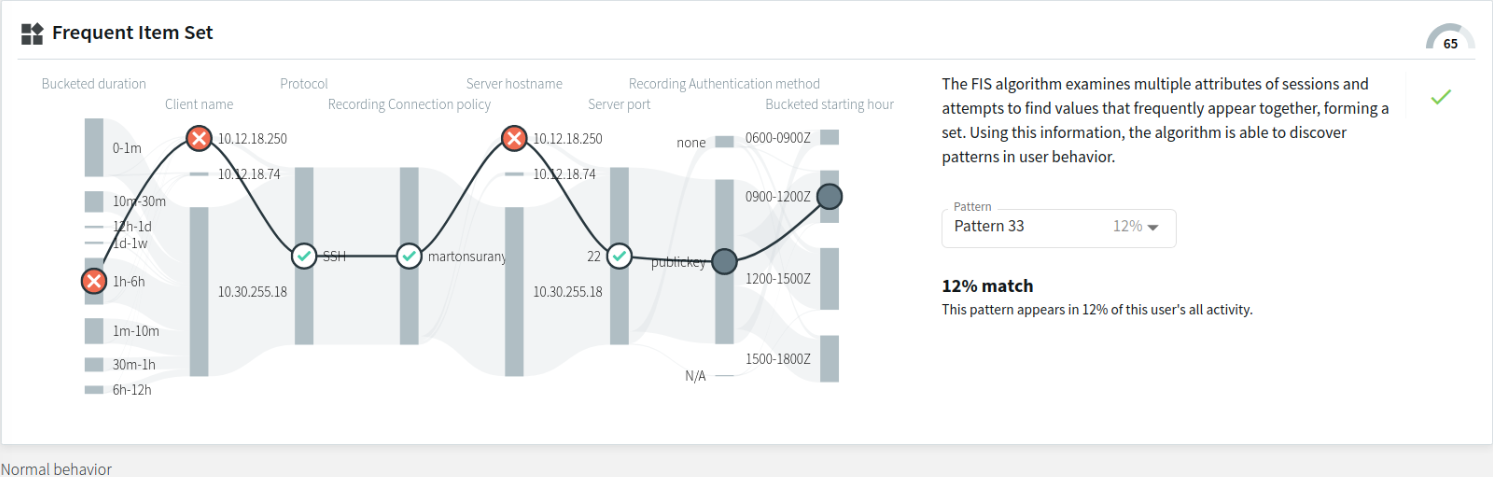
- Pattern with a low match percentage to this user's sessions during the observed analysis period
The example below displays a pattern with a low match percentage, appearing in only 12% of this user's previous sessions during the observed analysis period. There are 3 attribute nodes that match ( marked with
Figure 35: Sessions — FIS flow view - a pattern with a low match percentage
With the baseline generated every day on average (usually during hours with less heavy traffic), the baseline itself is continuously changing. As a result, the available patterns are also continuously changing over time.
Pattern match percentage
The pattern match percentage is a percentage value displayed under the pattern selection drop-down list, next to the pattern name (for example, Pattern 0 | Pattern 1, and so on).
Figure 36: Sessions — FIS flow view - the pattern match percentage
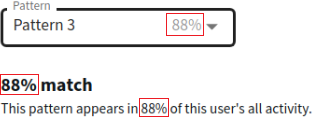
The percentage value always matches the value displayed next to the Pattern options (other than the Default option) in the drop-down list. The percentage indicates to what percent the selected pattern matches this user's sessions during the observed analysis period. Patterns that appear in less than 10% of this user's sessions during the observed analysis period are not displayed in the drop-down list as Pattern options (but may appear in the overall sum of Total count data, as mentioned in Displaying further details of individual Connection segments.
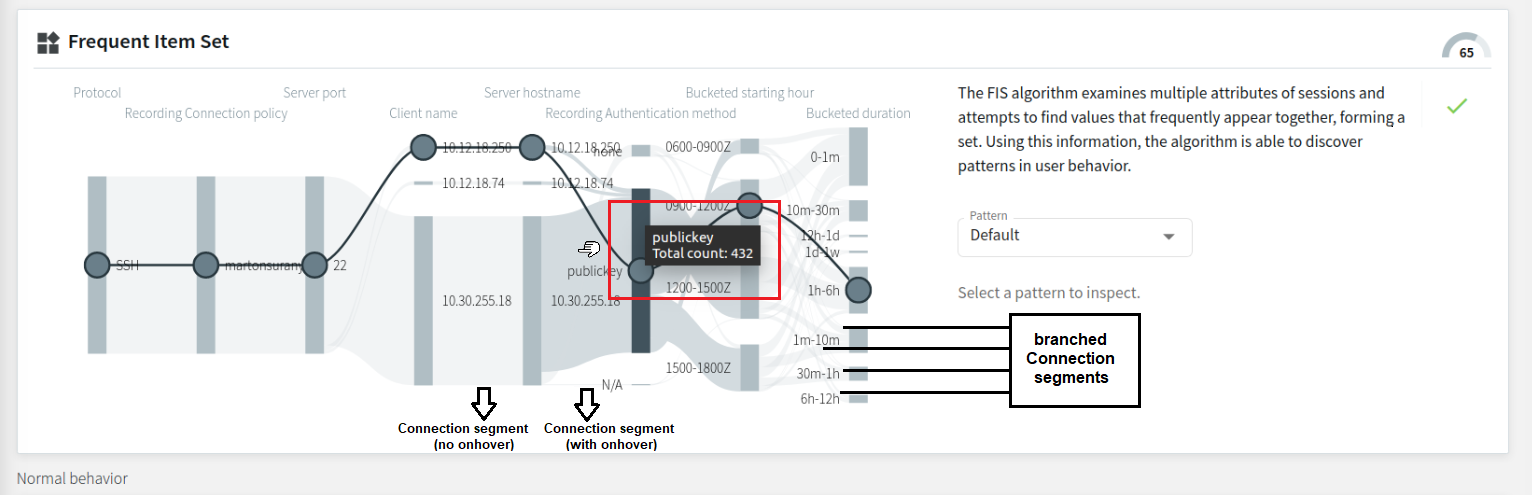
Displaying further details of individual Connection segments
Hovering on an individual Connection segment of the visual displays the exact number of occurrences of that particular attribute value during the observed analysis period. When the Connection splits to several branches (for example, in the example below, the Connection splits into separate branches according to Bucketed starting hour), hovering over the branched Connection segment of your choice will display that particular attribute's further details (namely, the attribute data (for example, IP addresses), and the Total count).
NOTE: The Total count values include session data originating from patterns that appear in less than 10% of the user's sessions during the observed analysis period.
Figure 37: Search — Hovering on particular Connection segments to display further details