
Changing log verbosity level of One Identity Safeguard for Privileged Sessions (SPS)
The logging level of One Identity Safeguard for Privileged Sessions (SPS) can be set separately for every protocol.
|
|
NOTE:
The Basic Settings > Management > Verbose system logs > Enable option is not related to the verbosity of traffic logs: it increases the log level of the non-network-related events, for example adds the commands executed by the SPS web interface to the logs, and so on. |

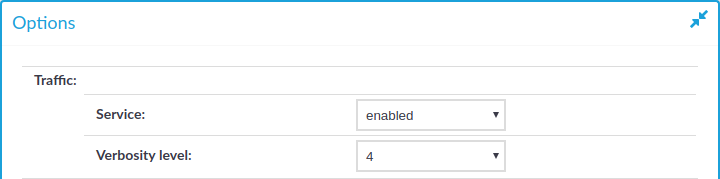
Figure 286: <Protocol name> Control > Global Options — Changing the verbosity level
To change the verbosity level of SPS
-
Navigate to the Global Options page of the traffic you want to change the log level of, for example, to SSH Control > Global Options to change the log level of SSH traffic, RDP Control > Global Options for remote desktop traffic, and so on.
-
Select the desired log level from the Verbosity level field. Note that the new verbosity level applies only to new sessions started after committing the change. The verbosity level of active sessions will not change.
NOTE: The verbosity level ranges from 1 (no logging) to 10 (extremely detailed), with level 4 being the default normal level. To debug complex problems, you might have to increase the verbosity level to 7. Higher level is needed only in extreme cases.
Caution: High verbosity levels generate very large amount of log messages and might result in a very high load on the machine.
For log levels 8-10, the logs contain highly sensitive data for all connections, as well as passwords and private keys in plain text format.
-
Click
.
-
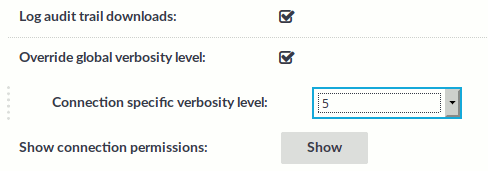
Optional: To set a different verbosity level for sessions that belong to a specific Connection Policy, complete the following steps:
-
Navigate to the Connection Policy you want to modify.
-
Select Override global verbosity level.
-
Select the desired log level from the Connection specific verbosity level field. Note that the new verbosity level applies only to new sessions started after committing the change. The verbosity level of active sessions will not change.
-
Click
-

Collecting logs and system information for error reporting
To track down support requests, the One Identity Support Team might request you to collect system-state and debugging information. This information is collected automatically, and contains log files, the configuration file of One Identity Safeguard for Privileged Sessions (SPS), and various system-statistics.
|
|
NOTE:
Sensitive data like key files and passwords are automatically removed from the files, that is, configuration files do not contain passwords or keys. However, if you increase the proxy verbosity level to 8-10 in the Global Options, then for troubleshooting purposes, the logs can contain highly sensitive data, for example, passwords and keys in plain text format. If you are concerned about the presence of sensitive data, check the collected log files before submitting to the Support Portal. The Basic Settings > Management > Verbose system logs > Enable option is not related to the verbosity of log messages: it adds the commands executed by the SPS web interface to the log. |
To collect system-state information (also known as a support bundle), navigate to Basic Settings > Troubleshooting > Create support bundle and click Create support bundle, then save the created zip file. The name of the file uses the debug_info-<hostname>YYYYMMDDHHMM format.
To collect information for a specific error
-
Navigate to Basic Settings > Troubleshooting > Create support bundle.
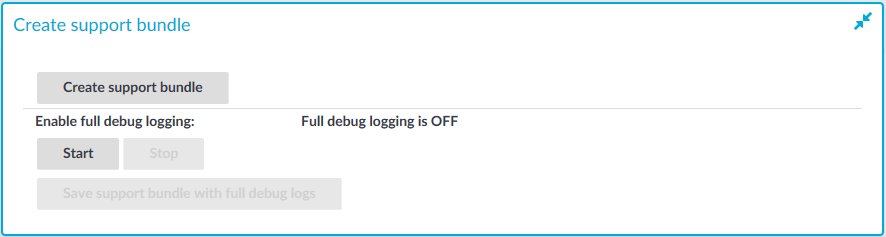
Figure 287: Basic Settings > Troubleshooting > Create support bundle — Collecting debug information
-
Click Start.
NOTE: Starting a full debug logging increases the log level of SPS, and might cause performance problems if the system is under a high load.
For troubleshooting purposes, the logs can contain highly sensitive data, for example, passwords and keys in plain text format. If you are concerned about the presence of sensitive data, check the collected log files before submitting to the Support Portal.
-
Reproduce the event that causes the error, for example connect to a server.
-
Click Stop.
-
Click Save support bundle with full debug logs and save the created zip file. The name of the file uses the debug_info-<hostname>YYYYMMDDHHMM format.
SPS includes the configuration files of any plugins installed. Note that depending on the plugin, these configuration files can contain sensitive information, such as passwords or API keys. In this case, edit the plugin-related files in the plugins directory of the support bundle and delete the sensitive information.
-
Attach the file to your support ticket.
Support hotfixes
This section describes support hotfixes and their installation in One Identity Safeguard for Privileged Sessions (SPS).
Support hotfixes are official additions (signed .deb packages created by the Support Team) to a specific SPS release. By uploading a hotfix to an SPS appliance, it is possible to apply a modification (for example, a bugfix) quickly and without making the firmware Tainted. The hotfix files only work with the version of SPS they are created for.
You can upload the hotfix file you received from our Support Team in the SPS user interface.
|
|
Caution:
Consider the following:
If you have to delete an individual hotfix file from SPS without installing a new firmware first, contact our Support Team. |
Installing support hotfixes
This section describes the most important requirements and information regarding the installation procedure of support hotfixes.
Prerequisites
The hotfix files are normally not publicly accessible for download (unless attached to Knowledgebase Articles). As a result, if you want to install them to your SPS, you must first contact our Support Team for a hotfix file specifically created for your request. Consider that you cannot delete the installed hotfix file from SPS without the Support Team's assistance. In addition, rebooting the SPS appliance after deleting an installed hotfix is necessary. We strongly recommend that you only install hotfixes to SPS if you contact our Support Team for instructions beforehand.
|
|
NOTE:
The hotfix files only work with the version of SPS they are created for. SPS automatically checks their version during upload. |
To install the support hotfix file
- Navigate to Basic Settings > System > Firmwares.
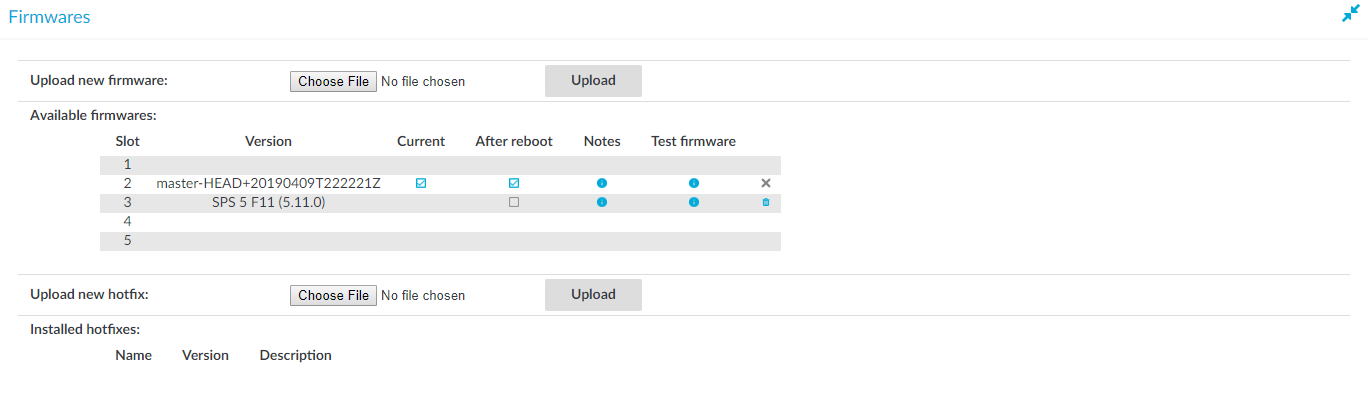
Figure 288: Uploading a hotfix file in the SPS user interface
- Under the Upload new hotfix: section, click Choose File and select the hotfix file you want to upload.
-
Click Upload.
Caution: Consider the following:
- Clicking Upload immediately installs the hotfix to SPS.
- Installing multiple hotfix files to a single configuration of SPS is possible, but you cannot delete an individual hotfix file from SPS without the Support Team's assistance.
- Installing a new firmware will delete all hotfix files installed on the previous version of SPS.
If you have to delete an individual hotfix file from SPS without installing a new firmware first, contact our Support Team.
-
If installation is successful, SPS will list information about the hotfix under Installed hotfixes:, such as Name, Version and Description.
NOTE: Upload will fail in the following cases:
- The hotfix file version does not pass the version check.
- The hotfix file package is not properly signed by our Support Team.
- The file you want to upload is not an appropriate .deb package or the file is corrupted.
If upload fails, SPS will revert to its previous state automatically.
Status history and statistics
SPS displays various statistics and status history of system data and performance on the dashboard at Basic Settings > Dashboard. The dashboard is essentially an extension of the system monitor: the system monitor displays only the current values, while the dashboard creates graphs and statistics of the system parameters.
The dashboard consists of different modules. Every module displays the history of a system parameter for the current day. To display the graph for a longer period (last week, last month, or last year), select the Week, Month, or Year options, respectively. Hovering the mouse over a module enlarges the graph and displays the color code used on the graph.
All types of data is collected every five minutes. This means that if changes are more frequent, it might not be represented in the graphs.
|
|
NOTE:
If all parameters displayed are 0 at a certain point in time, it might mean that at that time One Identity Safeguard for Privileged Sessions (SPS) was not functional (for example, turned off or unresponsive). Or, in certain cases it might also mean that there was no information at that time. |
|
|
NOTE:
If you want to compare data displayed on the Dashboard to data displayed on the System Monitor, they might be different, because data on System Monitor is based on SNMP values, whereas data on the related Dashboard modules are based on the output of different commands. |
To display statistics of a module as a table for the selected period, click on the graph.
Figure 289: Basic Settings > Dashboard — The dashboard

The following modules are displayed on the dashboard of SPS:
-
Connection statistics: Number of active connections per protocol.
-
Memory: The memory used by the system.
-
Disk: Filesystem usage for the different partitions.
-
CPU: CPU usage.
-
Network connections: Number of network connections.
-
Physical interface 1 (eth0): Traffic on physical interface 1.
-
Physical interface 2 (eth1): Traffic on physical interface 2.
-
Physical interface 3 (eth2): Traffic on physical interface 3.
-
Load average: Average load of the system.
-
Number of processes: The number of running processes.