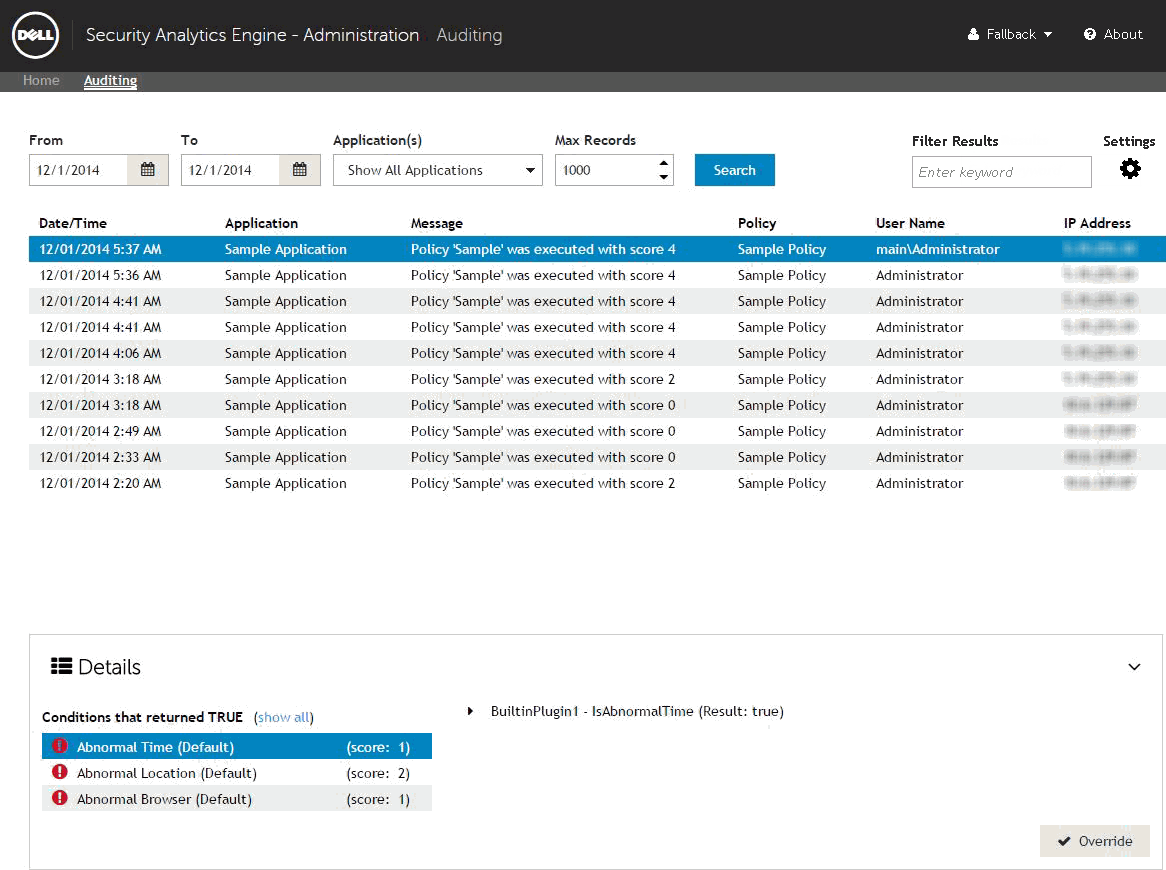
Auditing page
|
If the new number of days is less than the previous number of days, all auditing information currently stored in the database which does NOT fit within the new range will be permanently deleted. Resetting the number of days back to the previous setting will NOT undo the deletion.
|
Filtering the audit events
|
1 |
From the Home page, click Auditing to open the Auditing page. |
|
2 |
|
3 |
|
4 |
In the Application(s) field, select to display auditing information for all applications or a specific application. |
|
5 |
In the Max Records field, set the maximum number of records (1-10000) to return for the search. By default, this is 1000 records. |
|
6 |
Click the Search button to update the Audit Events table. |
|
7 |
To further filter the list of events, enter characters into the Filter Results field. The Audit Events table is updated automatically. |
Configuring the retention settings
|
If the new number of days is less than the previous number of days, all auditing information currently stored in the database which does NOT fit within the new range will be permanently deleted. Resetting the number of days back to the previous setting will NOT undo the deletion.
|
|
1 |
From the Home page, click Auditing to open the Auditing page. |
|
2 |
|
4 |
Click the Save button to save the changes. |
|
5 |
A confirmation dialog will appear. Click the Save button. |
Displaying details for an individual audit event
|
1 |
From the Home page, click Auditing to open the Auditing page. By default, the audit events for the current day are displayed. |
|
2 |
Select an event and click the Details button on the bottom left of the page (see Filtering the audit events for information on locating a specific event and/or an event from a previous date). |
|
4 |
Selecting a condition from the left column will display additional information in the right column regarding the condition. Each condition includes the following additional details: |
|
• |
<plugin name> - <condition name> (Result: <true/false>) - This displays the name of the plugin, the name of the condition and whether the condition returned as true or false during the access attempt. For example, BuiltinPlugin1 - IsAbnormalTime (Result: true). |
|
• |
Parameters - Use the expand properties button (right arrow) to the left of this heading to display each condition parameter with its current setting. For example, Days = 30. |
|
• |
Details - Use the expand properties button (right arrow) to the left of this heading to display information on what caused the condition to trigger or not trigger during the access attempt. |
|
5 |
To close the Details panel, click the Details button. |


