
Prerequisites and restrictions
- To visualize events from SPS, you must have your SPS configured to forward events to Splunk and the Splunk Add-on installed.
- To use the gap analysis function, you must have the Splunk App and the Splunk Add-on for Microsoft Windows or the Splunk Add-on for Unix and Linux installed.
Installation
For information about the setup process, see The Splunk App.
Visualizing events using the One Identity Safeguard for Privileged Sessions dashboard
The One Identity Safeguard for Privileged Sessions dashboard visualizes data from SPS (including your events parsed and indexed by the Splunk Add-on and the metadata that the Splunk Add-on attaches to those events).
To access the One Identity Safeguard for Privileged Sessions dashboard
- Login to the Splunk Enterprise online administration page.
- Select One Identity Safeguard for Privileged Sessions under Apps.
Figure 1: The One Identity Safeguard for Privileged Sessions dashboard
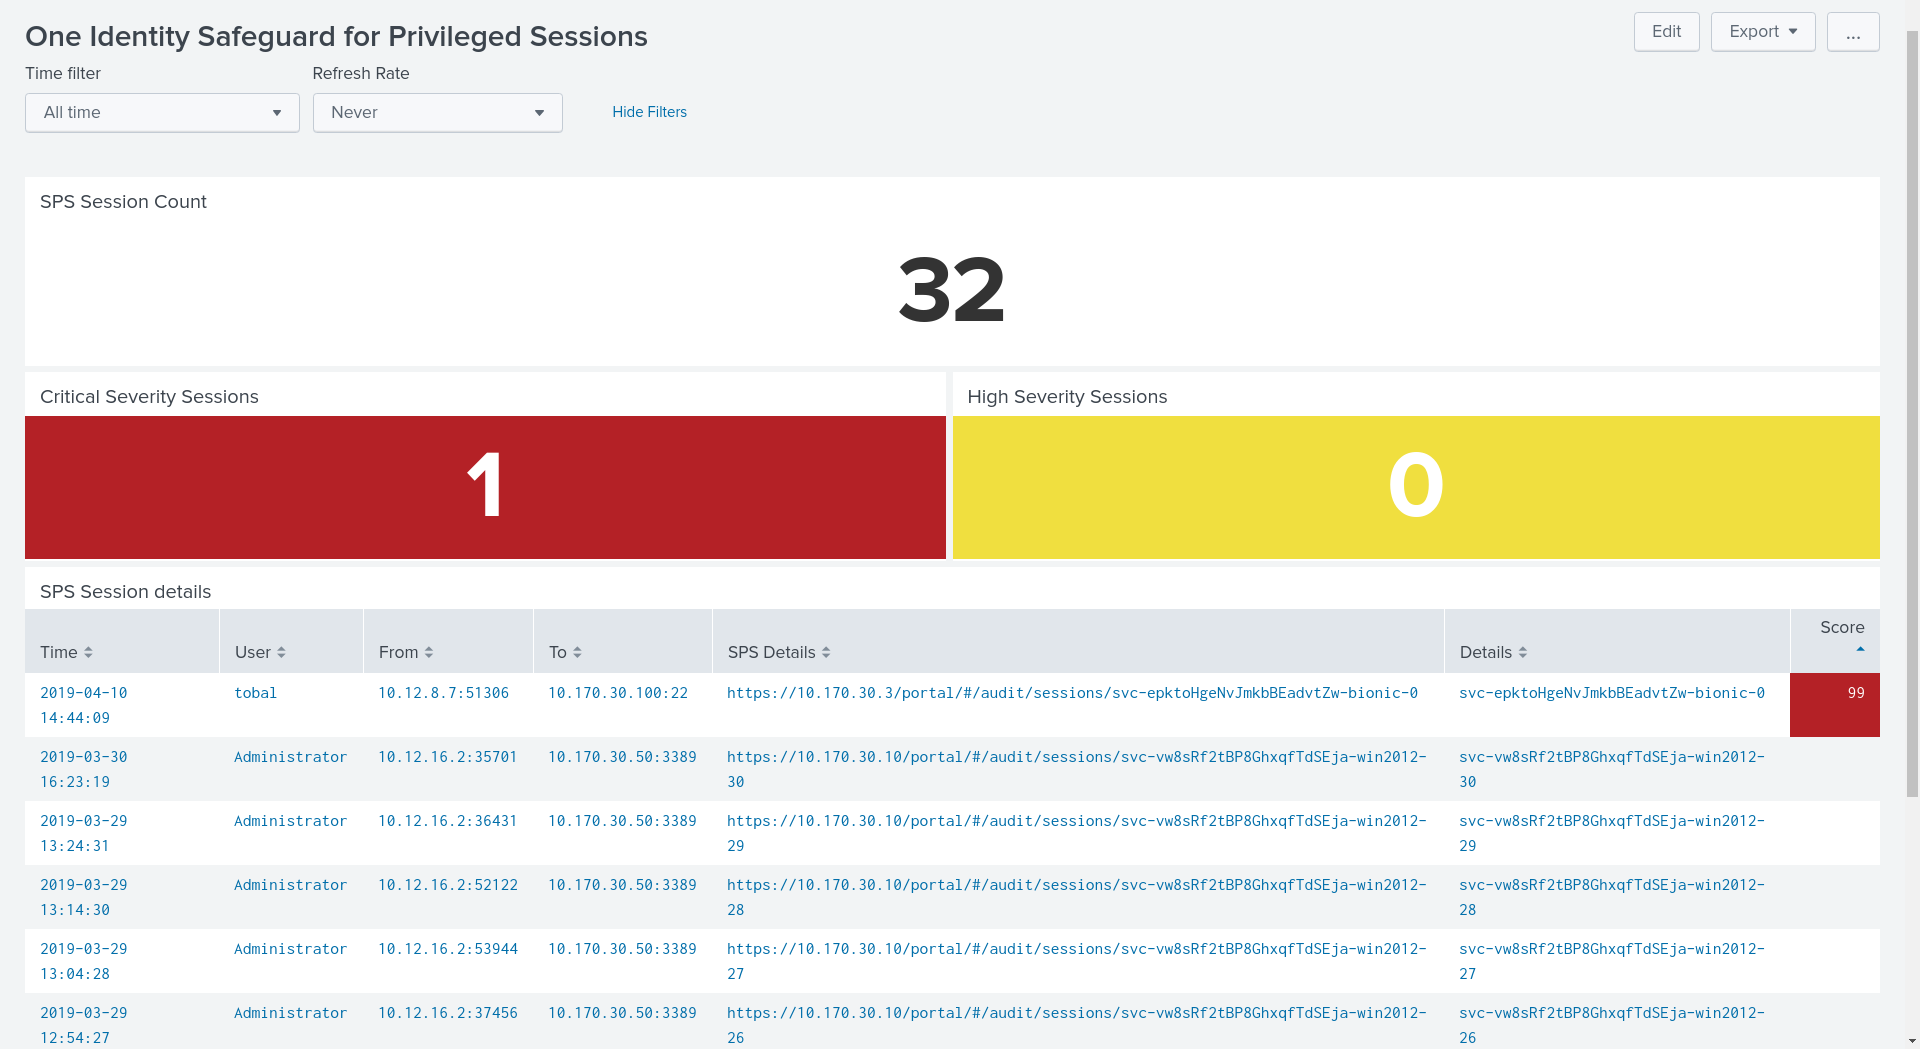
The top filters bar allows you to configure your filters, the middle section shows an overview of logged sessions, and the lower section shows a more detailed list of audited sessions.
Under Time filter you can set a time interval in which you want to browse your data, and configure relevant settings. Under Refresh Rate you can specify a refresh rate (if you want to). To hide the Time filter and Refresh Rate items, click Hide Filters/Show Filters.
Below the filters bar, you see the details of logged sessions (such as SPS Session Count, the number of Critical Severity Sessions, and the number of High Severity Sessions) in the given time range.
The listed elements below SPS Session details show the audited sessions.
The One Identity Gap Report dashboard
The One Identity Gap Report dashboard allows you to use other sources of information about your audited hosts (for example, Microsoft Windows logs or Unix/Linux logs) as well as those originating from SPS to compare the two sources of information and see if all the necessary sessions are audited without audit gaps
To access the One Identity Gap Report dashboard
- Login to the Splunk Enterprise online administration page.
- Select One Identity Safeguard for Privileged Sessions under Apps.
- Click One Identity Gap Report on the top tab bar to switch from the the One Identity Safeguard for Privileged Sessions dashboard.
Figure 2: The One Identity Gap Report dashboard
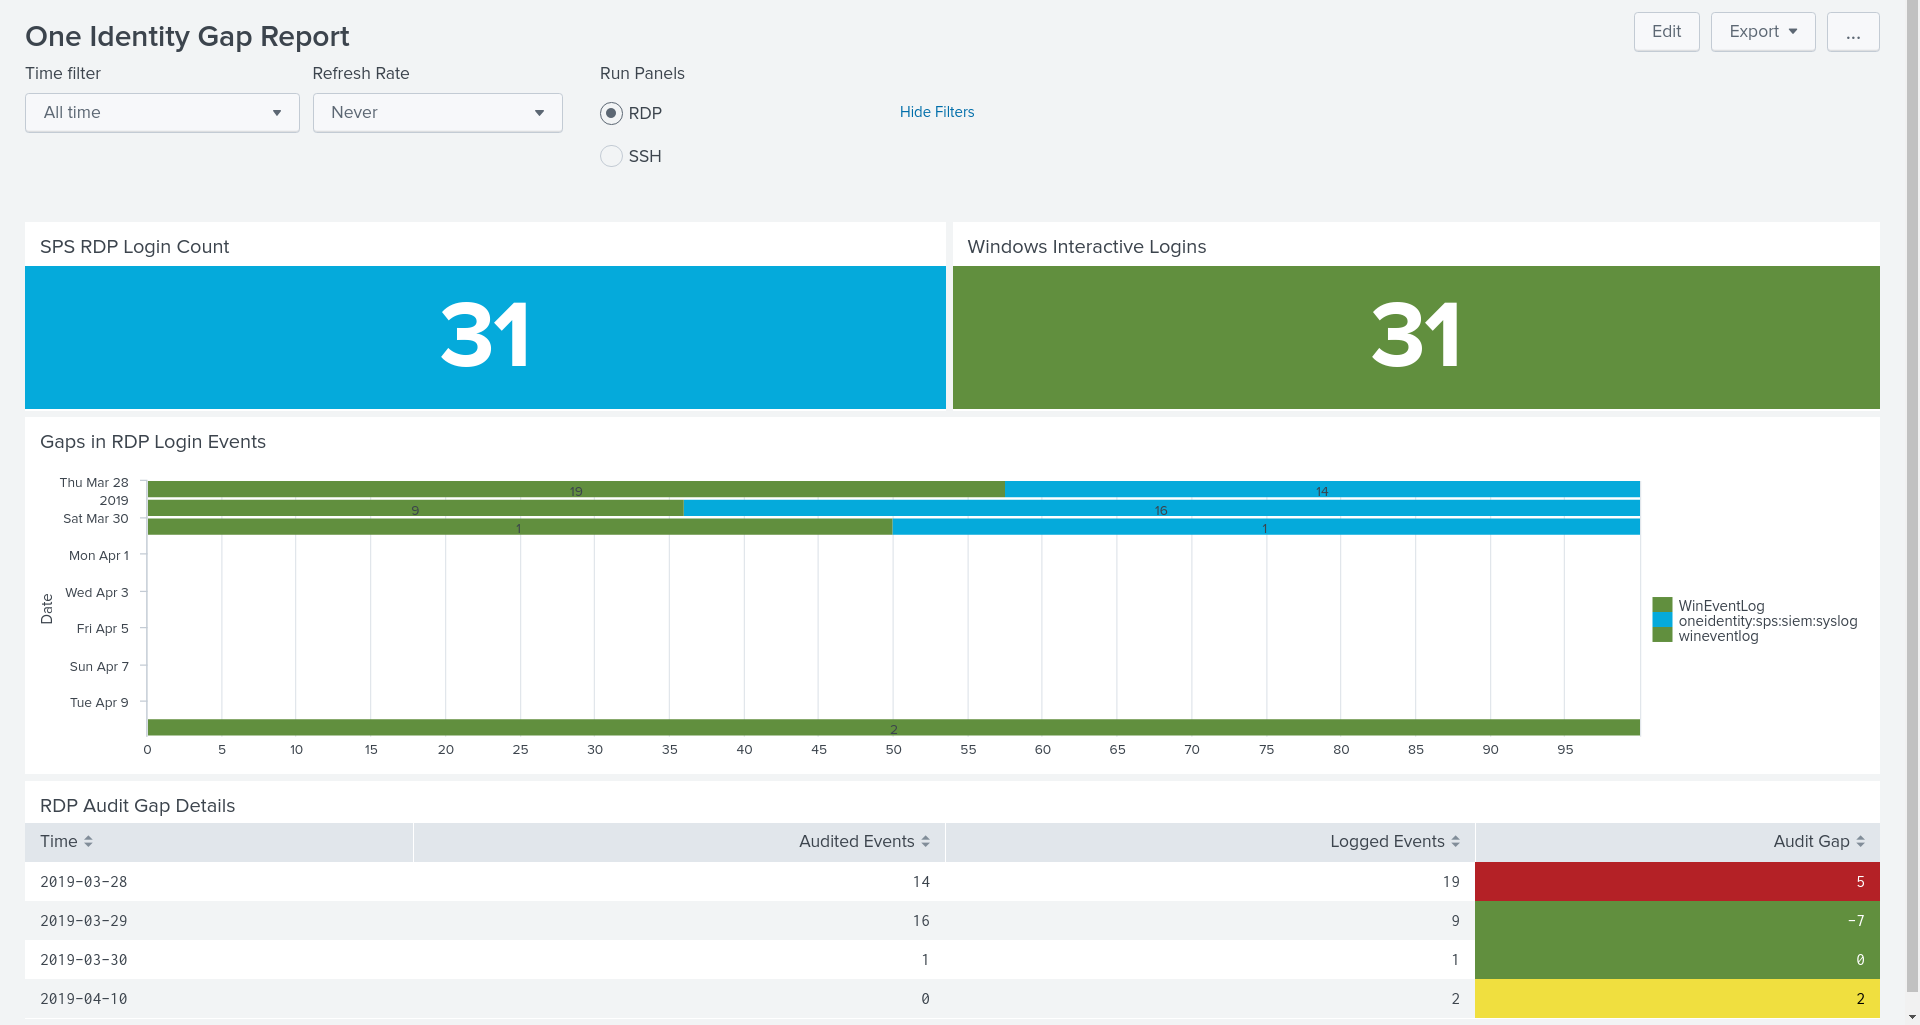
The top filters bar allows you to configure your filters and whether you want to visualize your RDP or your SSH sessions, the middle section shows an overview of logged sessions, and the lower section shows a more detailed list of unaudited sessions.
You can set a time interval in which you want to browse your data, and configure relevant settings under the Time filter. Under Refresh Rate you can specify a refresh rate (if you want to). The Run Panels option allows you to switch between RDP and SSH sessions. To hide the Time filterand Refresh Rate items, click the Hide Filters/Show Filters.
Below the filters bar, you see the number of audited sessions (under SPS RDP Login Count), and the number of logged sessions (under Windows Interactive Logins) in the given time range.
Under Gaps in RDP Login Events, a bar chart shows the proportion between audited and logged sessions, by day.
Under RDP Audit Gap Details, you can see the specific data (such as Time (for the audit gap date), the number of Audited Events, the number of Logged Events and the number of unaudited sessions, under Audit Gap), grouped by day.