
This document summarizes the findings of several performance tests and measurements carried out on different versions of syslog-ng Premium Edition. The main focus was syslog-ng PE version 6 LTS, but similar performance tests are performed and published regularly with every major syslog-ng PE release.
Performance Guideline for syslog-ng Premium Edition 6 LTS
Performance Guideline for syslog-ng Premium Edition 6 LTS
Executive summary
The main findings of the performance tests are as follows:
-
The fastest way the syslog-ng PE application can receive log messages from the network is using plain TCP transport with the
network()source driver. -
By default, syslog-ng PE runs in multithreaded mode to scale to multiple CPUs or cores for increased performance.
Depending on the exact syslog-ng PE configuration, environment, and other parameters, syslog-ng PE is capable of processing:
-
over 590,000 messages per second (over 220 MB of data per second) when receiving messages from multiple connections and storing them in text files
-
over 560,000 messages per second (210 MB of data per second) when receiving messages from multiple connections and storing them in logstore files (that is, encrypted files)
-
over 565,000 messages per second (over 210 MB of data per second) when receiving messages from multiple secure (TLS-encrypted) connections and storing them in text files.
-
-
The tests were performed using real log messages of 130-2000 bytes and of varying complexity, obtained from real machines. The tests ran for 10 minutes.
-
PatternDB only works on one thread. Therefore, using PatternDB can significantly decrease performance depending on how many messages match a pattern in the specified ruleset. If a large amount of messages are being received but the specified pattern matches a small number of messages, there is no significant performance degradation.
-
Using disk buffer on the client side can significantly degrade performance. This is especially the case if relays that are heavily loaded are used together with disk buffer enabled on the relays. Performance can also be degraded if lots of messages are received on the syslog-ng server, and are forwarded through the network (for example to a log analyzer or SIEM), and therefore disk buffer is enabled on the server as well.
-
Higher
stats_leveldecreases the performance. For example,stats_level(2)means -10% in performance. -
Simple filtering (for example, filtering on facility or tag) has no impact on performance at all. However, regular expressions, even simple ones, significantly decrease the message-processing rate, by about 40-45%.
-
Results of the performance tests show a standard deviation of +-5%. This means that when comparing measurements of a particular dimension (for example, non-encrypted versus encrypted log processing), a difference of 5% does not necessarily indicate a real difference in performance.
Sources
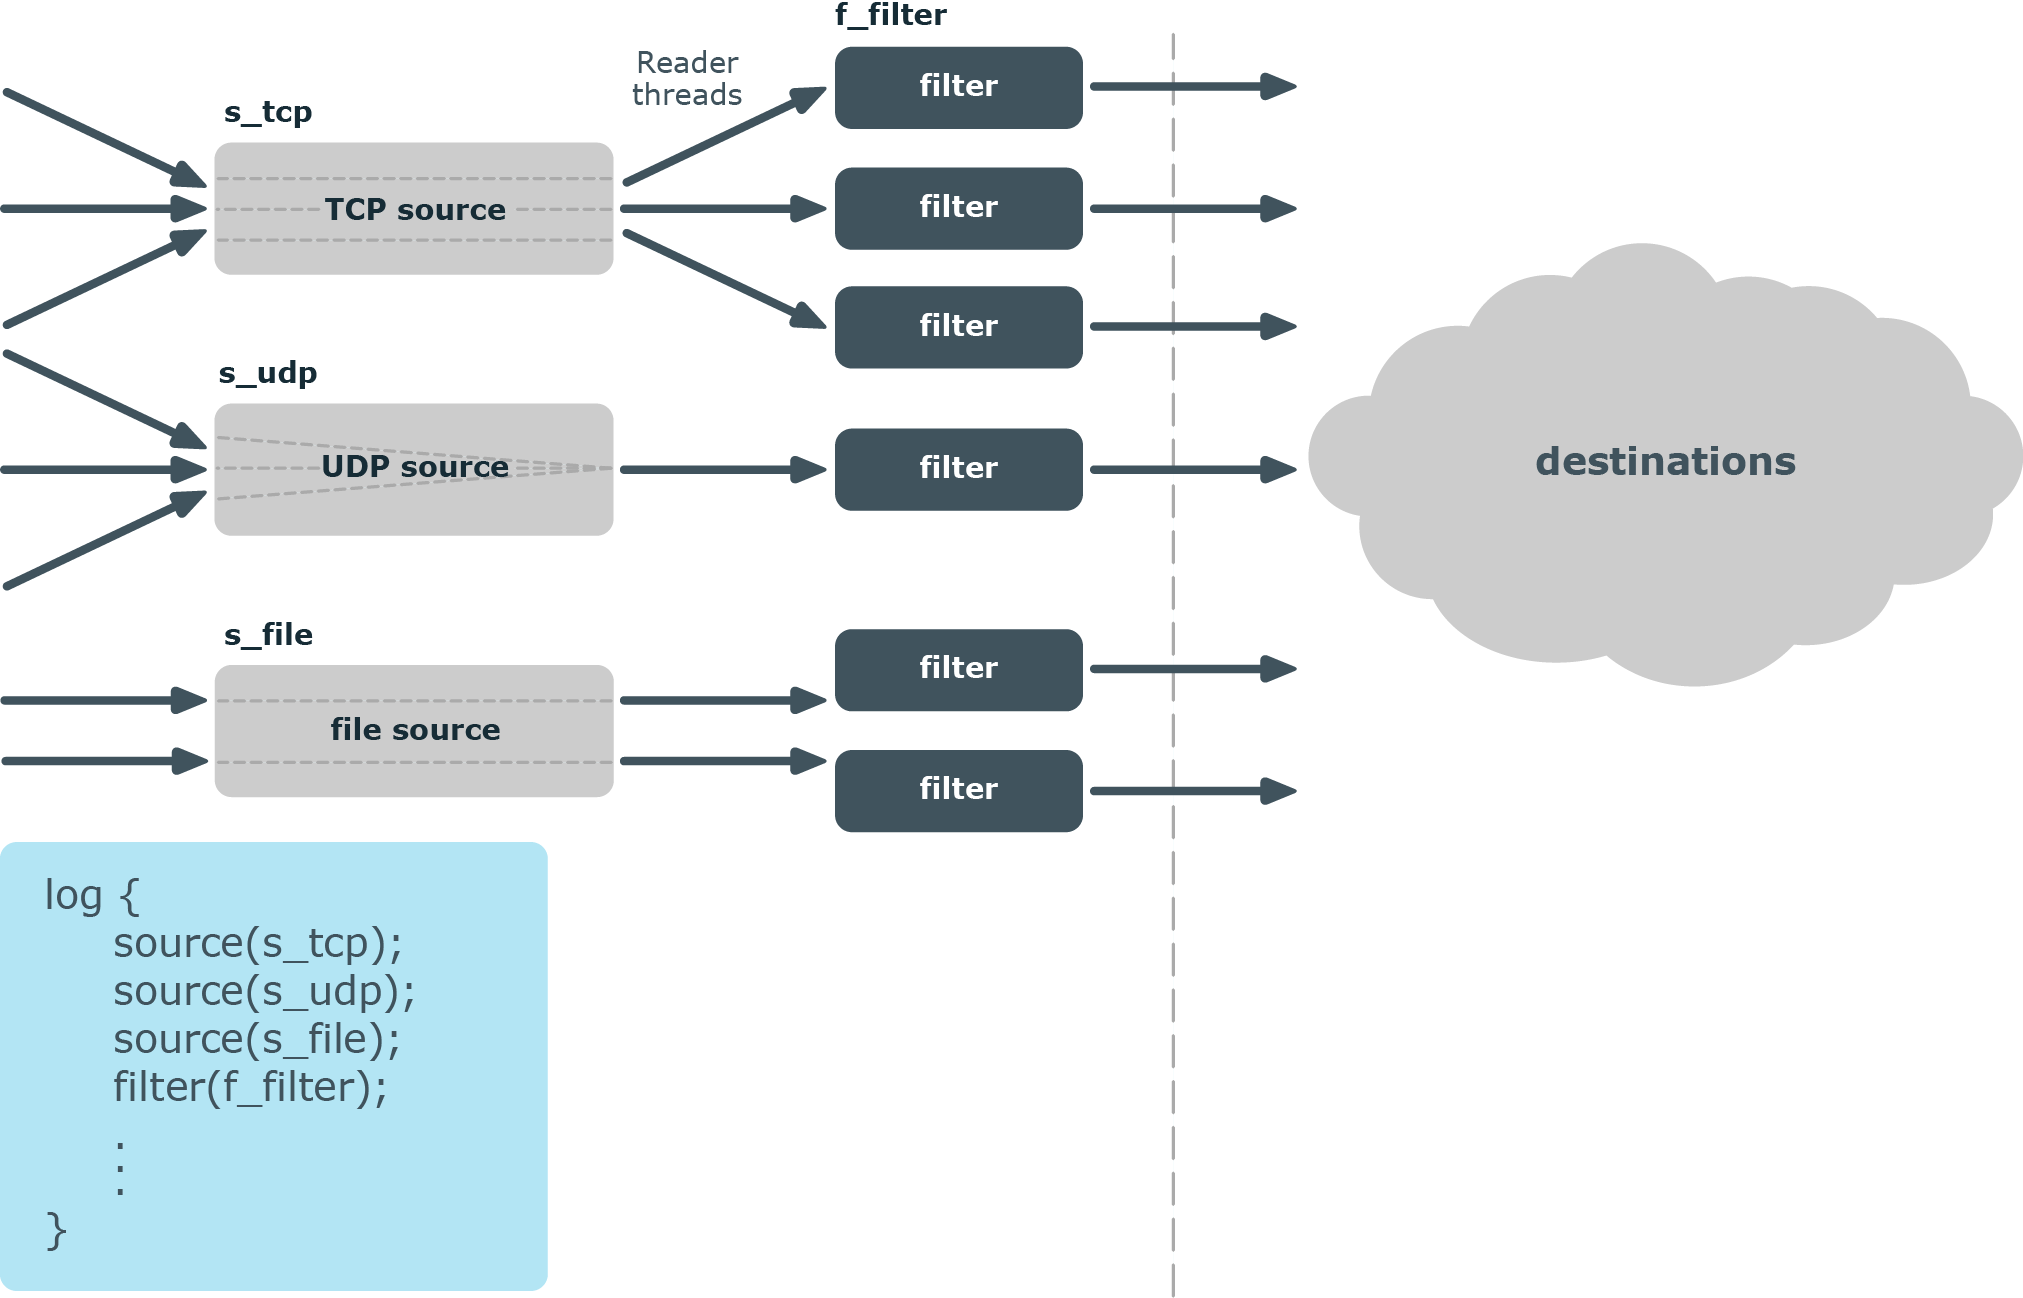
In syslog-ng, every source has a reader thread. To improve scaling on the source side, use multiple sources instead of one.
For example, if you are using a file source with a wildcard character (such as *.txt), syslog-ng will monitor every matching file (and keep switching between them), but will use only one thread. It is best to configure several single file sources (such as file source1, file source2, and so on) that all monitor only a single file or a smaller range of files. In this case, every file source will use its own thread.
TCP-based network sources form an exception: a TCP-based network source will scale based on the number of active connections. This means that if there are 10 incoming TCP connections all coming to the same network source, then that source can use 10 threads, one thread for each connection.
|
|
NOTE:
UDP-based network sources do not scale by themselves because they always use a single thread. If you want to handle a large number of UDP connections, it is best to configure a subset of your clients to send the messages to a different port of your syslog-ng server, and use separate source definitions for each port. |

Message processors
Message processors — such as filters, rewrite rules, and parsers — are executed by the reader thread in a sequential manner.
For example, if you have a log path that defines two sources and a filter, the filter will be performed by the source1 reader thread when log messages come from source1, and by the source2 reader thread when log messages come from source2. This means that if log messages come from both source1 and source2, they will both have a reader thread and that way filtering will be performed simultaneously.
|
|
NOTE:
This is not true for PatternDB because it uses message correlation. When using PatternDB, it runs in only one thread at a time, and this significantly decreases performance. |
Destinations
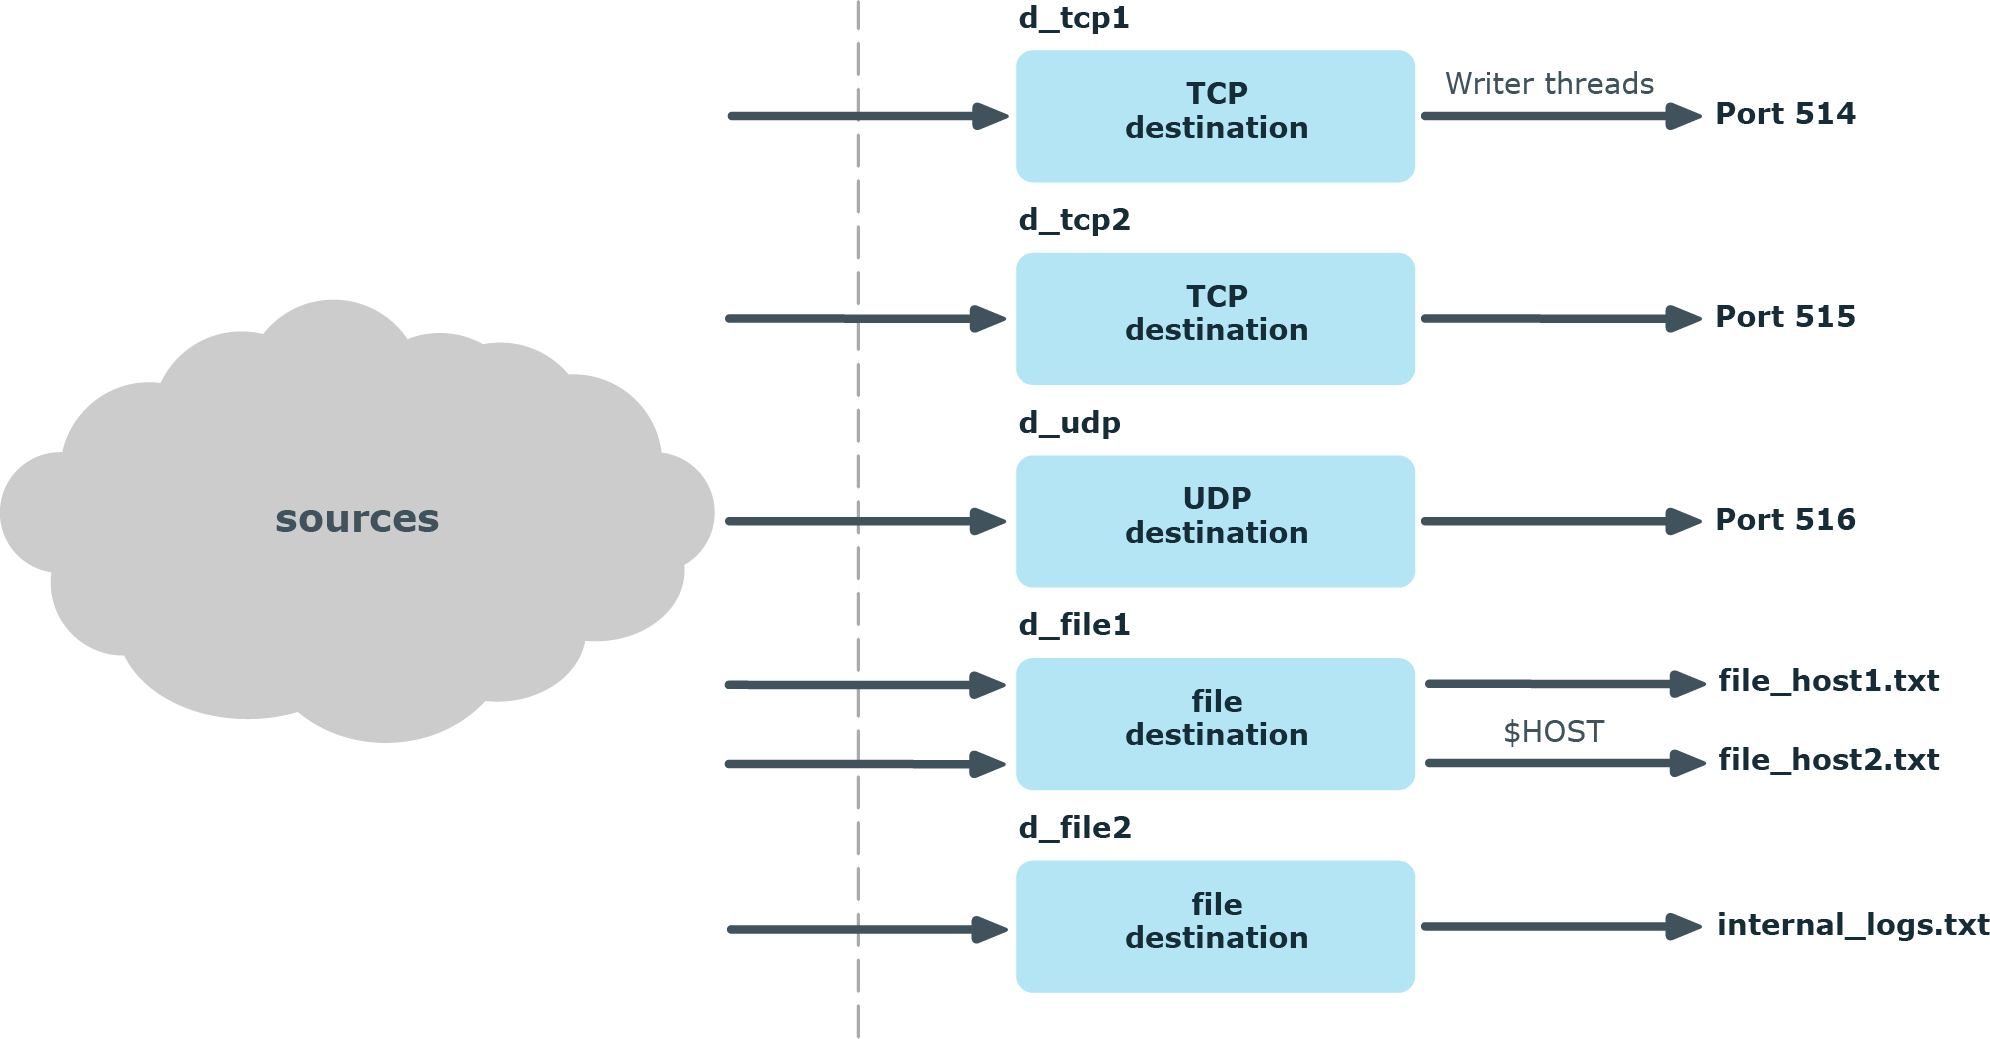
In syslog-ng, every destination has a writer thread. To improve scaling on the destination side, use multiple destinations instead of one.
For example, when sending messages to a syslog-ng server, you can use multiple connections to the server if you configure the syslog-ng server to receive messages on multiple ports, and configure the clients to use both ports.
When writing the log messages to files, use macros in the filename to split the messages to separate files (for example, using the ${HOST} macro). Files with macros in their filenames are processed in separate writer threads.
Improving performance with lots of connections
If there are several thousand active connections simultaneously, it is advised to place relay syslog-ng-s on another computer in front of the syslog-ng server. Switching between active connections is time-consuming, while the amount of incoming messages is usually not significant. This problem is solved by using relays, since they are collecting the logs. The syslog-ng solution can handle lots of log messages sent from a few connections easily.
In the case of non-encrypted connections, it is best to handle no more than 5,000 connections per syslog-ng PE application. While in the case of secure (TLS-encrypted) and Reliable Log Transfer Protocol™ (RLTP™) connections, a single syslog-ng PE application should handle no more than 1,000 connections.
When your environment has more connections than the numbers advised above, then our recommendation is that those should be handled by more than one syslog-ng PE application. For example, in the case of secure and RLTP™ connections, when there are 2,000 connections, employ two relays, each of them running one syslog-ng PE application and handling 1,000 connections.
Note, however, that the exact capacity of syslog-ng PE depends on your particular circumstances (such as hardware performance, number and complexity of log messages, and so on), and needs to be measured on an individual basis. The recommendations indicated here are valid in an environment that handles a maximum of 200,000 EPS.
Storing lots of log messages
It requires large free disk space if syslog-ng receives lots of messages per second (note that syslog-ng can process messages at even 225 MB/sec speed). In this case, it is advised to use compressed logstore files instead of plain text files for storing data. The size of a compressed logstore (compress(3)) is only a few percent of the file destination. Obviously, the effectiveness of the compression depends on the pattern of the incoming messages, but since most of the time the log messages consist of simple text messages, they can be compressed quite effectively (around 90% compression rate).
Filtering messages
It is advised to use the simplest filters when filtering incoming messages. If a message can be filtered with several types of filters, check the measured data. For example, if a message is filtered with a regexp, the performance of syslog-ng can drop down to 55-60% of the original performance level. Whereas if the tag or facility filters are used, there is no decrease in performance.
When using multiple filters one after the other, or connecting filters with the logical AND/OR operators, the order of filters has a significant impact on performance. We recommend to put those filters in front that are the most likely to match the incoming log messages (if known).
Identifying bottlenecks
It is advised to first identify the bottlenecks if the performance of syslog-ng seems to be too low. For example, if syslog-ng is writing on slow disks at the destination side, upgrading the source-side device will not help increasing the performance.
Log messages can be collected and processed at a faster rate in the latest version of syslog-ng Premium Edition compared to version 5 LTS and earlier versions but several configuration aspects will affect the rate at which log messages are collected and stored. The following tables show the results of tests performed with syslog-ng PE 6 LTS. Taking the following factors into consideration will optimize syslog-ng Premium Edition performance:
Number of network connections
In a multithreaded environment, an increase in connections will have no significant impact on the rate at which syslog-ng PE processes log messages.
Table 1. Number of network connections
| Number of Connections | Messages Per Second | Average Data Rate (MB/sec) |
|---|---|---|
| 10 | 600,000 | 225 |
| 50 | 575,000 | 215 |
| 100 | 555,000 | 210 |
| 200 | 565,000 | 210 |
| Configuration: path – TCP, destination – multiple files (using macros), message size: 400 bytes | ||
Encrypted log transfer
The syslog-ng PE application uses the Transport Layer Security (TLS) protocol to encrypt the communication. TLS also allows the mutual authentication of the host and the server using X.509 certificates.
Table 2. Encrypted log transfer — 10 connections
| Legacy syslog | IETF syslog | |||
|---|---|---|---|---|
| Not Encrypted | TLS Encryption | Not Encrypted | TLS Encryption | |
| Messages per second | 600,000 | 570,000 | 140,000 | 140,000 |
| Average data rate (MB/sec) | 225 | 215 | 70 | 70 |
| Configuration: path – TCP, multithreaded, 10 connections, destination – multiple files (using macros), message size: 400 bytes | ||||
Table 3. Encrypted log transfer — 100 connections
| Legacy syslog | IETF syslog | |||
|---|---|---|---|---|
| Not Encrypted | TLS Encryption | Not Encrypted | TLS Encryption | |
| Messages per second | 565,000 | 520,000 | 135,000 | 130,000 |
| Average data rate (MB/sec) | 210 | 195 | 70 | 65 |
| Configuration: path – TCP, multithreaded, 100 connections, destination – multiple files (using macros), message size: 400 bytes | ||||
Type of storage
The syslog-ng PE application can:
-
Store log messages securely in encrypted, compressed and timestamped binary files.
While using encrypted and compressed logstore files uses more CPU resources, data is stored more securely and requires less storage space.
-
Send syslog messages through the network to a syslog-ng PE server.
-
Store log messages in a database.
-
Store log messages in the Hadoop Distributed File System (HDFS).
-
Send log messages to Elasticsearch.
Table 4. Type of storage — 10 connections
| Type of Storage | Messages Per Second | Average Data Rate (MB/sec) |
|---|---|---|
| Plain text file | 290,000 | 110 |
| Multiple plain text files (using macros, with log messages divided by hostname) | 590,000 | 220 |
| Logstore | 210,000 | 80 |
| Multiple logstores (using macros, with log messages divided by hostname) | 560,000 | 210 |
| Network destination — legacy syslog | 360,000 | 135 |
| Network destination — IETF syslog with RLTP™ | 35,000 | 10 |
| Network destination — IETF syslog with RLTP™, compressed | 20,000 | 10 |
| Database destination — MongoDB |
In the case of MongoDB destinations, performance is influenced by a number of criteria unrelated to syslog-ng. If you need information on MongoDB-related performance measurements, contact Balabit. If you are an existing customer, contact the Balabit Support Team. Otherwise, contact your Pre-Sales Engineer. | |
| Database destination — SQL |
In the case of SQL destinations, performance is influenced by a number of criteria unrelated to syslog-ng. If you need information on SQL-related performance measurements, contact Balabit. If you are an existing customer, contact our Support Team. Otherwise, contact your Pre-Sales Engineer. | |
|
Configuration: path – TCP, multithreaded, 10 connections, message size: 400 bytes Note: Writing into only one logstore cannot be scaled because of technical limitations even when syslog-ng receives messages from more connections. | ||
Table 5. Type of storage — 100 connections
| Type of Storage | Messages Per Second | Average Data Rate (MB/sec) |
|---|---|---|
| Plain text file | 425,000 | 160 |
| Multiple plain text files (using macros, with log messages divided by hostname) | 565,000 | 210 |
| Logstore | 210,000 | 80 |
| Multiple logstores (using macros, with log messages divided by hostname) | 580,000 | 215 |
| Network destination — legacy syslog | 330,000 | 125 |
| Network destination — IETF syslog with RLTP™ | 30,000 | 10 |
| Network destination — IETF syslog with RLTP™, compressed | 20,000 | 10 |
| Database destination — MongoDB |
In the case of MongoDB destinations, performance is influenced by a number of criteria unrelated to syslog-ng. If you need information on MongoDB-related performance measurements, contact Balabit. If you are an existing customer, contact our Support Team. Otherwise, contact your Pre-Sales Engineer. | |
| Database destination — SQL |
In the case of SQL destinations, performance is influenced by a number of criteria unrelated to syslog-ng. If you need information on SQL-related performance measurements, contact Balabit. If you are an existing customer, contact our Support Team. Otherwise, contact your Pre-Sales Engineer. | |
| HDFS | 140,000 | 50 |
| Note: Processing speed is heavily influenced by the number of HDFS data nodes in use. When syslog-ng writes multiple files to HDFS, and Hadoop places these on different data nodes, then processing speed might increase in proportion to the number of data nodes used (not necessarily in a linear fashion). The data provided here shows performance in the case of a single data node. | ||
| Elasticsearch |
1,500 (with 10,500 (with |
1 (with 5 (with |
|
Configuration: path – TCP, multithreaded, 100 connections, message size: 400 bytes Note: Writing into only one logstore cannot be scaled because of technical limitations even when syslog-ng receives messages from more connections. | ||
Number of files and directories when reading log messages from multiple plain text files
When reading log messages from a set of files, the number of directories and the number of files per directory used have no significant impact on performance.
Table 6. Number of files and directories
| Number of Directories | Number of Files Per Directory | Messages Per Second | Average Data Rate (MB/sec) |
|---|---|---|---|
| 1 | 1 | 105,000 | 40 |
| 10 | 100,000 | 40 | |
| 100 | 100,000 | 40 | |
| 10 | 1 | 100,000 | 40 |
| 10 | 100,000 | 40 | |
| 100 | 100,000 | 40 | |
| 100 | 1 | 100,000 | 40 |
| 10 | 100,000 | 40 | |
| 100 | 95,000 | 40 | |
| Configuration: path – TCP, multithreaded, File source message size: 400 bytes | |||
Disk buffer
The syslog-ng Premium Edition stores messages on the local hard disk if the central log server or the network connection to the server becomes unavailable.
Table 7. Disk buffer
| Without Disk Buffer | Reliable | Normal | |
|---|---|---|---|
| Messages per second | 360,000 | 40,000 | 50,000 |
| Average data rate (MB/sec) | 135 | 15 | 20 |
| Configuration: path – TCP, multithreaded, disk buffer: 1000 MB, 100 connections, message size: 400 bytes | |||
Log pre-processing
Depending on the type of pre-processing, the rate at which syslog-ng PE collects messages can vary. Regular Expressions, rewriting, using parsers, as well as pattern recognition processing through PatternDB have a significant impact on the message processing rate. Facility filtering and tag filtering have no impact at all.
Note that in a multithreaded environment, PatternDB has a particularly large impact on performance.
Table 8. Log pre-processing — 10 connections
| Messages Per Second | Average Data Rate (MB/sec) | |
|---|---|---|
| No pre-processing | 595,000 | 225 |
| All pre-processing (except PatternDB and JSON parser) | 190,000 | 70 |
| Simple regexp (for example, matching a single string) | 335,000 | 125 |
| Facility filter | 595,000 | 225 |
| Tag filter | 595,000 | 225 |
| PatternDB (10 % of messages matched) | 35,000 | 10 |
| Simple rewrite (for example, rewrite hostname) | 260,000 | 100 |
| JSON parser | 70,000 | 45 |
| kv parser | 205,000 | 75 |
| Configuration: path – TCP, multithreaded, 10 connections, message size: 400 bytes | ||
Table 9. Log pre-processing — 100 connections
| Messages Per Second | Average Data Rate (MB/sec) | |
|---|---|---|
| No pre-processing | 570,000 | 215 |
| All pre-processing (except PatternDB and JSON parser) | 230,000 | 90 |
| Simple regexp (for example, matching a single string) | 340,000 | 125 |
| Facility filter | 555,000 | 205 |
| Tag filter | 565,000 | 210 |
| PatternDB (10 % of messages matched) | 30,000 | 10 |
| Simple rewrite (for example, rewrite hostname) | 310,000 | 115 |
| JSON parser | 60,000 | 40 |
| kv parser | 225,000 | 85 |
| Configuration: path – TCP, multithreaded, 100 connections, message size: 400 bytes | ||
Application-level acknowledgement via Reliable Log Transfer Protocol™ (RLTP™)
The latest version of syslog-ng Premium Edition supports the RLTP™ that allows the logserver to notify clients when a message is received. The application-level acknowledgment has an effect on the number of log messages processed per second.
Performance is also heavily influenced by the degree of latency between two machines. This is due to how RLTP™ works. syslog-ng will not send a new batch of log messages until it has received acknowledgement from the receiving party about having processed the previous batch. When the acknowledgement takes longer to arrive (for example, because the machines are located on different continents), that can impact processing speed. In such cases, our recommendation is to increase the value of the flush-lines() parameter, which determines how many lines of log messages are sent to a destination at a time.
Table 10. Application-level acknowledgement via Reliable Log Transfer Protocol™ (RLTP™) — 10 connections
| TCP | RLTP™ | |
|---|---|---|
| Messages per second | 600,000 | 180,000 |
| Average data rate (MB/sec) | 224 | 90 |
|
Configuration: multithreaded, 10 connections, message size: 400 bytes Note: This result is measured on the server side. When RLTP™ is applied on a relay server, both the source side and the destination side apply RLTP™, which would decrease performance slightly. | ||
Table 11. Application-level acknowledgement via Reliable Log Transfer Protocol™ (RLTP™) — 100 connections
| TCP | RLTP™ | |
|---|---|---|
| Messages per second | 560,000 | 180,000 |
| Average data rate (MB/sec) | 211 | 90 |
|
Configuration: multithreaded, 100 connections, message size: 400 bytes Note: This result is measured on the server side. When RLTP™ is applied on a relay server, both the source side and the destination side apply RLTP™, which would decrease performance slightly. | ||
The test environment
The test environment consisted of a single client and a server hardware, connected via a Gigabit switch. Note that in certain test runs, the client opened several separate connections to the servers to simulate real-life logging environments. The syslog-ng Premium Edition application was installed from the .run package.
Hardware parameters:
The client hardware had the following main parameters:
-
2x Intel® Xeon® Processor E5-2620 v3 (15M Cache, 2.40 GHz, 8 GT/s Intel® QPI, 6 cores)
-
Hyperthreading disabled, turbo boost disabled
-
16 GB RAM
-
10 Gbps Ethernet
-
HDD 500 GB
-
Operating system:
ubuntu-xenial amd64
The server hardware had the following main parameters:
-
2x Intel® Xeon® Processor E5-2620 v3 (15M Cache, 2.40 GHz, 8 GT/s Intel® QPI, 6 cores)
-
Hyperthreading disabled, turbo boost disabled
-
16 GB RAM
-
10 Gbps Ethernet
-
SSD 500 GB
-
Operating system:
ubuntu-xenial amd64
Performance improvement:
The following settings were used for performance improvement:
-
Improving performance with lots of connections:
max_connections = active_connections
log_iw_size = number of active_connections * 1000
log_fetch_limit = 1000
flush_lines = 1000
log_fifo_size = log_iw_size * 2
use_dns = no
keep_hostname = yes
keep_timestamp = no -
Improving performance with a few connections but high amount of traffic:
Source side:
log_iw_size = number of active_connections * 100,000
log_fetch_limit = 100,000Destination side:
log_fifo_size = max_connections * (log_iw_size/number of active_connections)
flush_lines = 10,000 or greater
Resource usage:
The performance tests were carried out in multithreaded mode:
threaded(yes)
One way to optimize the resource usage of syslog-ng PE is to limit the number of worker threads that syslog-ng uses. This helps prevent syslog-ng PE from using all available CPUs. You can limit the number of worker threads using the --worker-threads command-line option that sets the maximum total number of threads syslog-ng PE can use, including the main syslog-ng PE thread.
Note, however, that SQL sources and destinations, as well as Java destinations, such as Elasticsearch, HDFS, and Apache Kafka, always run in their own, separate threads. This means that the --worker-threads command-line option has no impact on them.