
This document summarizes the findings of several performance tests and measurements carried out on different versions of syslog-ng Premium Edition. The main focus was syslog-ng PE version 7.0, but similar performance tests are performed and published regularly with every major syslog-ng PE release.
Preface
Preface
Executive summary
Executive summary
The main findings of the performance tests are as follows:
-
The fastest way the syslog-ng PE application can receive log messages from the network is using plain TCP transport with the network() source driver.
-
By default, syslog-ng PE runs in multithreaded mode to scale to multiple CPUs or cores for increased performance.
Depending on the exact syslog-ng PE configuration, environment, and other parameters, syslog-ng PE is capable of processing:
-
over 635,000 messages per second (over 235 MB of data per second) when receiving messages from multiple connections and storing them in text files,
-
over 615,000 messages per second (over 230 MB of data per second) when receiving messages from multiple secure (TLS-encrypted) connections and storing them in text files.
-
-
The tests were performed using real log messages of 135-2100 bytes and of varying complexity, obtained from real machines. The tests ran for 10 minutes.
-
PatternDB only works on one thread. Therefore, using PatternDB can significantly decrease performance depending on how many messages match a pattern in the specified ruleset. If a large amount of messages are being received but the specified pattern matches a small number of messages, there is no significant performance degradation.
-
Using disk buffer on the client side can significantly degrade performance. This is especially the case if relays that are heavily loaded are used together with disk buffer enabled on the relays. Performance can also be degraded if lots of messages are received on the syslog-ng server, and are forwarded through the network (for example, to a log analyzer or SIEM), and therefore disk buffer is enabled on the server as well.
-
Higher stats_level decreases the performance. For example, stats_level(2) means -10% in performance.
-
Simple filtering (for example, filtering on facility or tag) has no significant impact on performance. However, regular expressions, even simple ones, slightly decrease the message-processing rate, by about 15%.
-
Results of the performance tests show a standard deviation of +-5%. This means that when comparing measurements of a particular dimension (for example, non-encrypted versus encrypted log processing), a difference of 5% does not necessarily indicate a real difference in performance.
Optimizing multithreaded performance
Sources
File sources scale based on the number of files that the syslog-ng PE is reading. If there are 10 files all coming to the same source, then that source can use 10 threads, one thread for each file.
NOTE: When collecting log messages from multiple files, the file source is a wildcard-file() source.
TCP-based network sources scale based on the number of active connections. This means that if there are 10 incoming connections all coming to the same source, then that source can use 10 threads, one thread for each connection.
NOTE: UDP-based network sources do not scale by themselves because they always use a single thread. If you want to handle a large number of UDP connections, it is best to configure a subset of your clients to send the messages to a different port of your syslog-ng server, and use separate source definitions for each port.
Figure 1: How multithreading works — sources
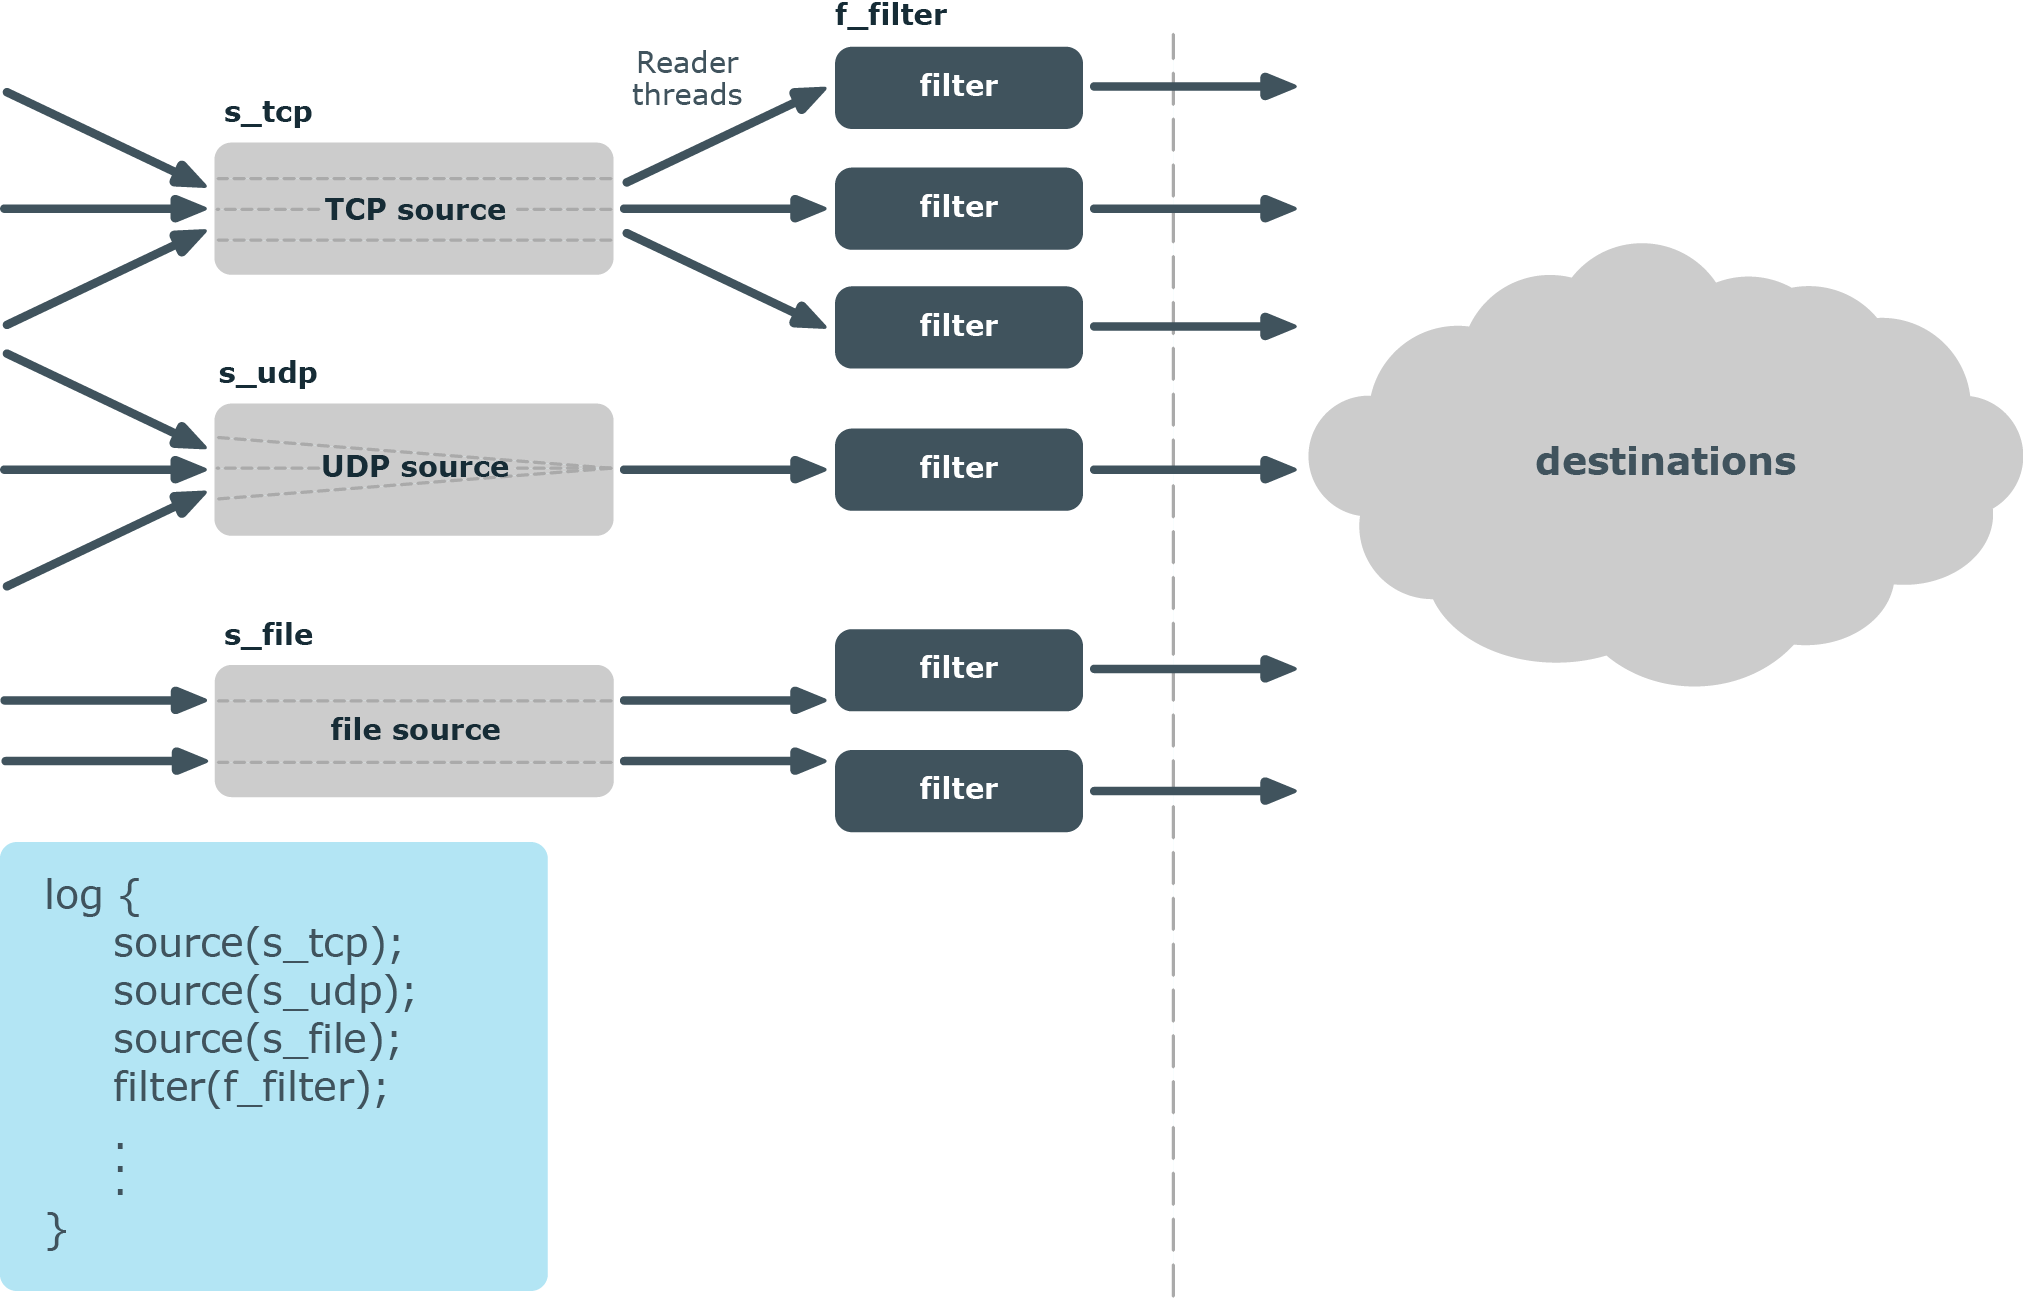
Message processors
Message processors — such as filters, rewrite rules, and parsers — are executed by the reader thread in a sequential manner.
For example, if you have a log path that defines two sources and a filter, the filter will be performed by the source1 reader thread when log messages come from source1, and by the source2 reader thread when log messages come from source2. This means that if log messages come from both source1 and source2, they will both have a reader thread and that way filtering will be performed simultaneously.
NOTE: This is not true for PatternDB because it uses message correlation. When using PatternDB, it runs in only one thread at a time, and this significantly decreases performance.
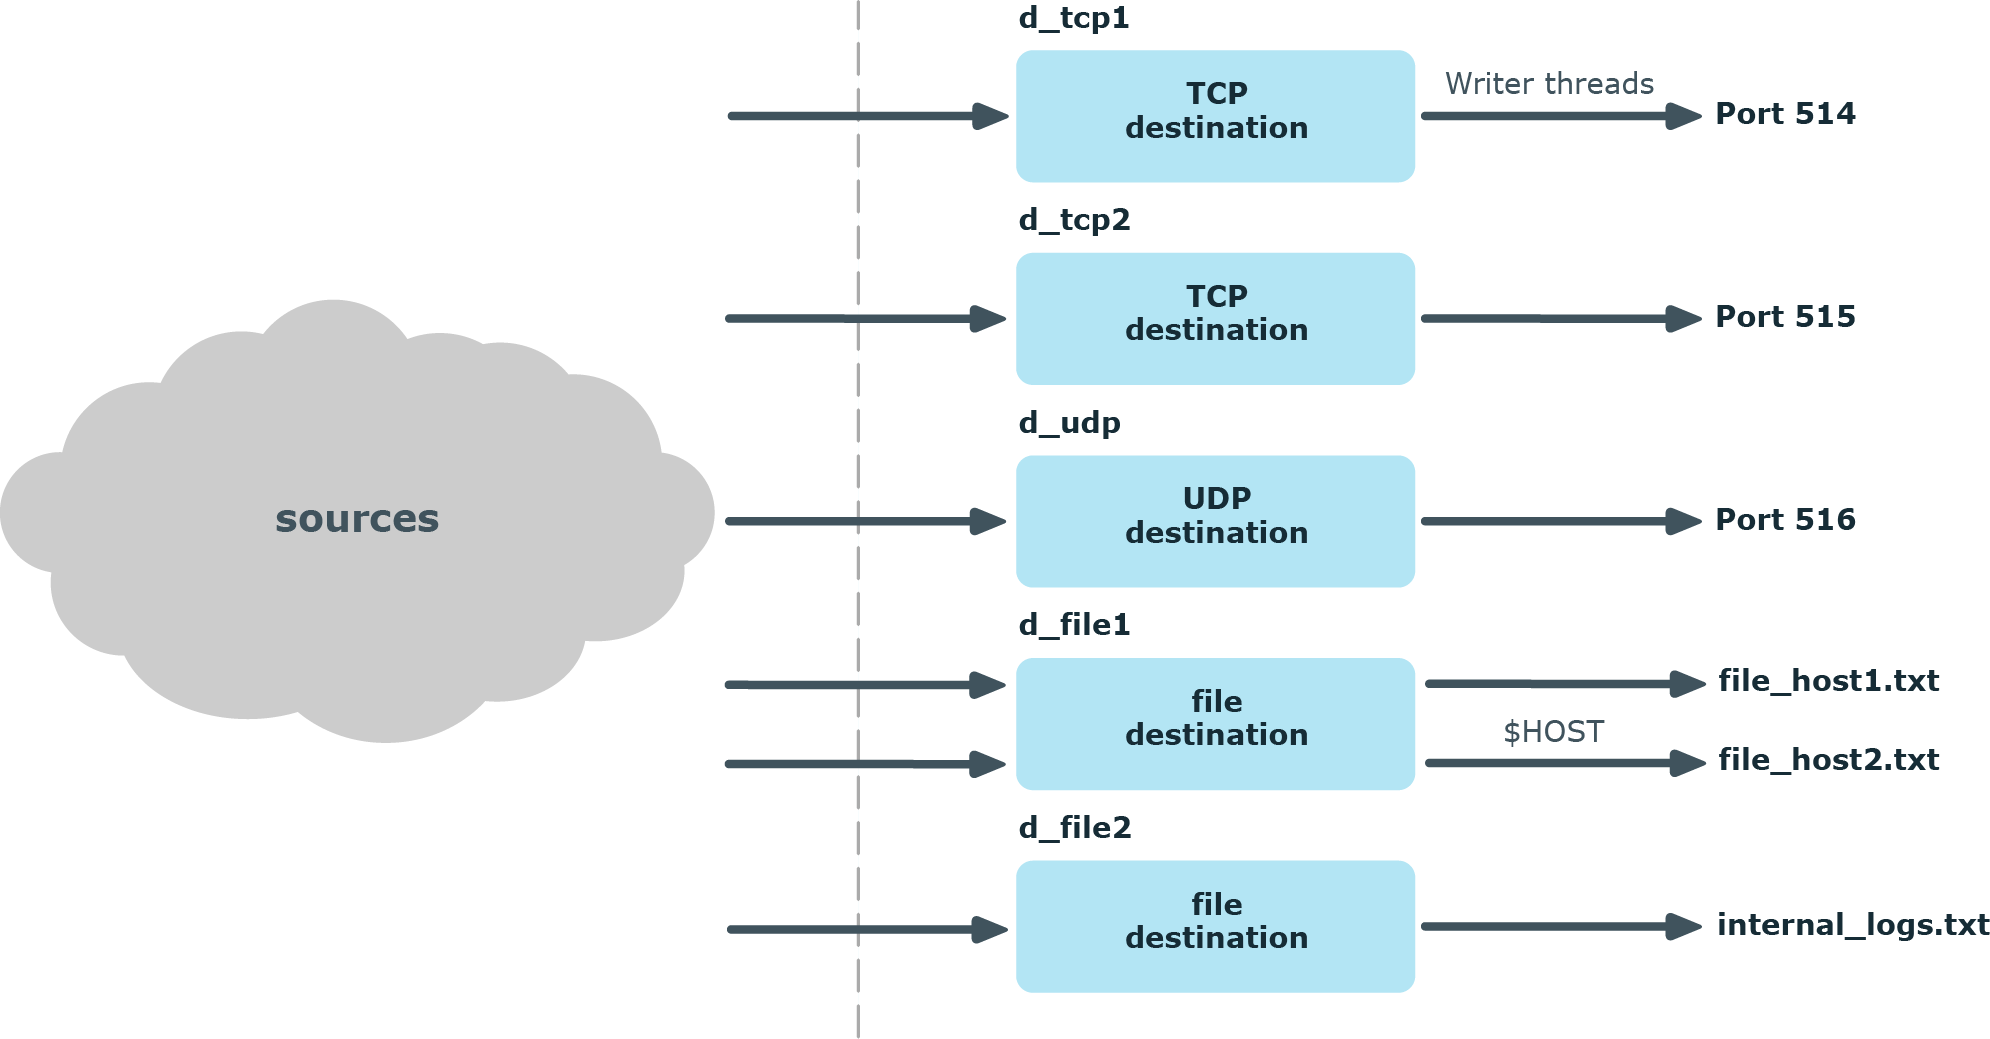
Destinations
In syslog-ng, every destination has a writer thread. To improve scaling on the destination side, use multiple destinations instead of one.
For example, when sending messages to a syslog-ng server, you can use multiple connections to the server if you configure the syslog-ng server to receive messages on multiple ports, and configure the clients to use both ports.
When writing the log messages to files, use macros in the filename to split the messages to separate files (for example, using the ${HOST} macro). Files with macros in their filenames are processed in separate writer threads.
Figure 2: How multithreading works — destinations
Use cases for performance improvement
Improving performance with lots of connections:
If there are several thousand active connections simultaneously, it is advised to place relay syslog-ng-s on another computer in front of the syslog-ng server. Switching between active connections is time-consuming, while the amount of incoming messages is usually not significant. This problem is solved by using relays, since they are collecting the logs. The syslog-ng solution can handle lots of log messages sent from a few connections easily.
In the case of non-encrypted connections, it is best to handle no more than 5,000 connections per syslog-ng PE application. While in the case of secure (TLS-encrypted) connections, a single syslog-ng PE application should handle no more than 1,000 connections.
When your environment has more connections than the numbers advised above, then our recommendation is that those should be handled by more than one syslog-ng PE application. For example, in the case of secure connections, when there are 2,000 connections, employ two relays, each of them running one syslog-ng PE application and handling 1,000 connections.
Note, however, that the exact capacity of syslog-ng PE depends on your particular circumstances (such as hardware performance, number and complexity of log messages, and so on), and needs to be measured on an individual basis. The recommendations indicated here are valid in an environment that handles a maximum of 200,000 EPS.
Filtering messages:
It is advised to use the simplest filters when filtering incoming messages. If a message can be filtered with several types of filters, check the measured data. For example, if a message is filtered with a regexp, the performance of syslog-ng can drop down to 85% of the original performance level. Whereas if the tag or facility filters are used, the decrease in performance is between 1-5%.
When using multiple filters one after the other, or connecting filters with the logical AND/OR operators, the order of filters has a significant impact on performance. We recommend to put those filters in front that are the most likely to match the incoming log messages (if known).
Identifying bottlenecks:
It is advised to first identify the bottlenecks if the performance of syslog-ng seems to be too low. For example, if syslog-ng is writing on slow disks at the destination side, upgrading the source-side device will not help increasing the performance.