Troubleshooting One Identity Safeguard for Privileged Sessions (SPS)
This section describes the tools to detect networking problems, and also how to collect core dump files and view the system logs of One Identity Safeguard for Privileged Sessions (SPS).
If you need to find the SPS appliance in the server room, you can use IPMI to control the front panel identify light. On One Identity Safeguard for Privileged Sessions N10000, navigate to Basic Settings > System > Hardware information > Blink identification lights and click On to blink the LEDs of hard disk trays on the front of the SPS appliance in red.
Topics:
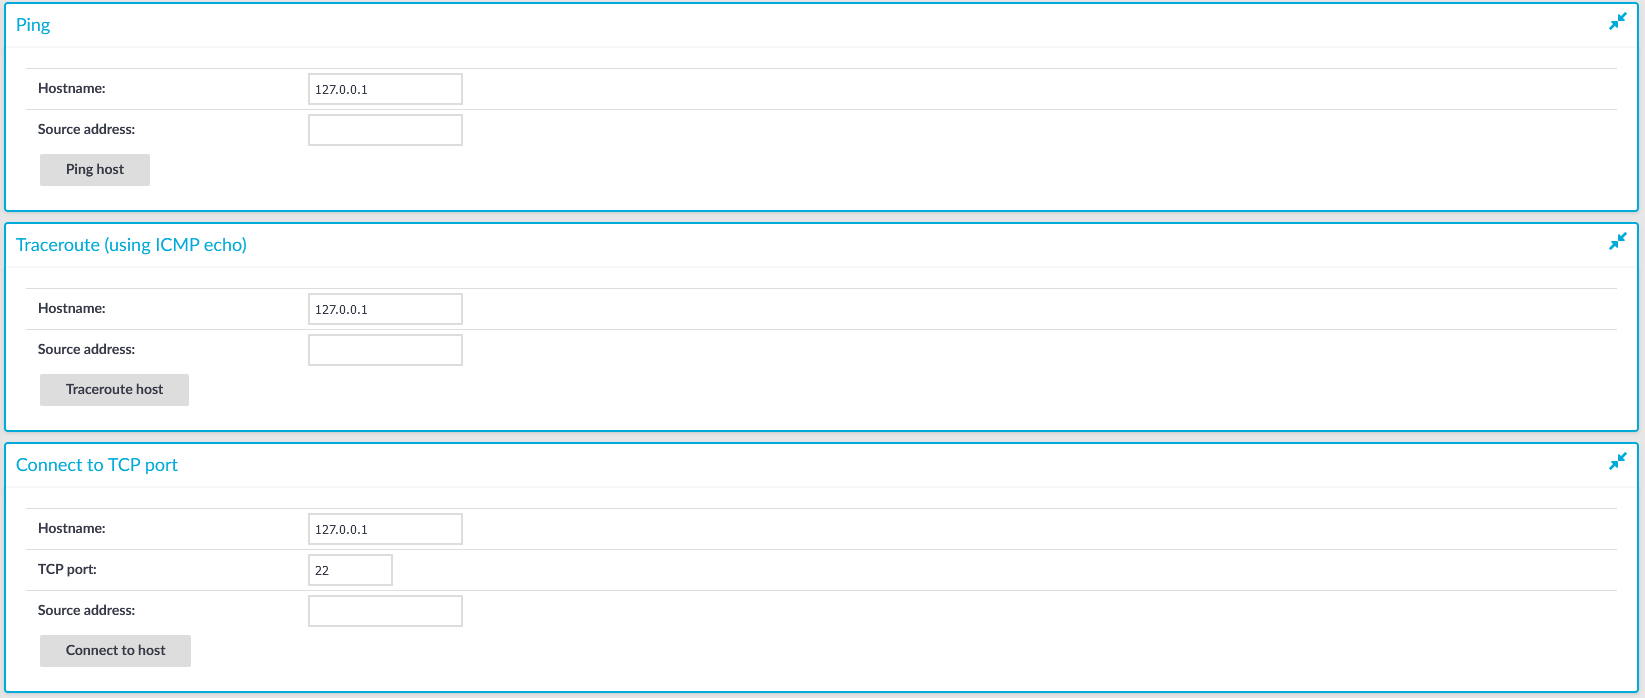
The Basic Settings > Troubleshooting menu provides a number of diagnostic commands to resolve networking issues. Logfiles of One Identity Safeguard for Privileged Sessions (SPS) can also be displayed here — for details, see Viewing logs on One Identity Safeguard for Privileged Sessions (SPS).
Figure 363: Basic Settings > Troubleshooting — Network troubleshooting with SPS


The following commands are available:
-
ping: Sends a simple message to the specified host to test network connectivity.
-
traceroute: Sends a simple message from SPS to the specified host and displays all hosts on the path of the message. It is used to trace the path the message travels between the hosts.
-
connect: Attempts to connect the specified host using the specified port. It is used to test the availability or status of an application on the target host.
To execute one of the above commands
-
Navigate to Basic Settings > Troubleshooting.
-
Enter the IP address or the hostname of the target host into the Hostname field of the respective command. For the Connect command, enter the target port into the TCP port field.
Use an IPv4 address.
-
Click the respective action button to execute the command.
-
Check the results in the pop-up window. Log files are displayed in a separate browser window.
One Identity Safeguard for Privileged Sessions (SPS) automatically generates core dump files if an important software component (for example, Zorp) of the system crashes for some reason. These core dump files can be of great help to the One Identity Support Team to identify problems. When a core dump file is generated, the SPS administrator receives an alerting e-mail, and an SNMP trap is generated if alerting is properly configured (for details, see Configuring system monitoring on SPS and System logging, SNMP and e-mail alerts).
To list and download the generated core dump files, navigate to Basic Settings > Troubleshooting > Core files.
By default, core dump files are deleted after 14 days. To change the deletion timeframe, navigate to Basic Settings > Management > Core files.
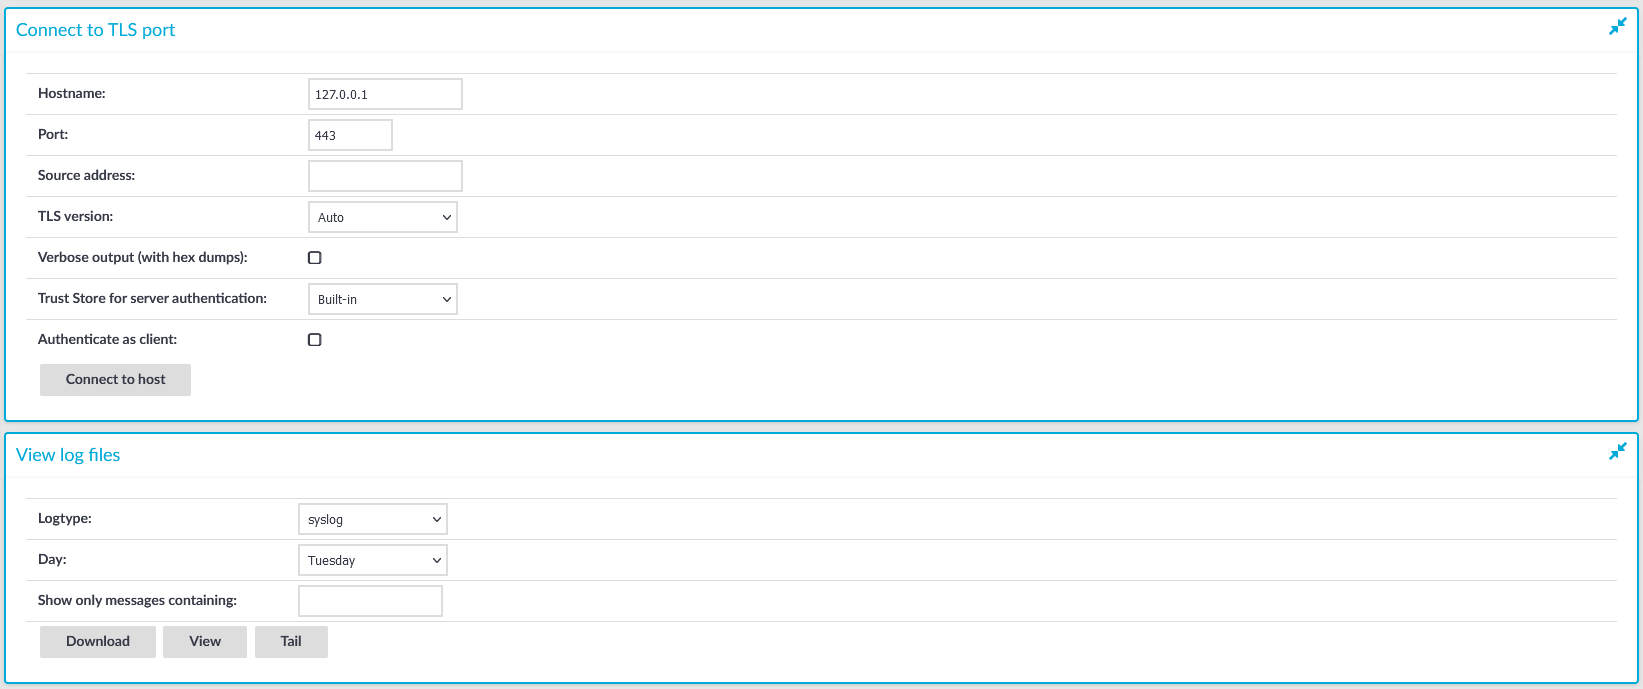
Figure 364: Basic Settings > Troubleshooting — System troubleshooting with SPS

The Troubleshooting menu provides an interface to view the logs generated by the various components of One Identity Safeguard for Privileged Sessions (SPS).
NOTE: Because of performance reasons, log files larger than 2 Megabytes are not displayed in the web interface. To access these logs, download the file instead.
To view logs on SPS
-
Navigate to Basic Settings > Troubleshooting > View log files.
Figure 365: Basic Settings > Troubleshooting — Viewing logs on SPS

-
Use the Logtype roll-down menu to select the message type.
-
syslog: All system logs of the SPS host.
-
scb: Logs of the SPS web interface.
- paa: Logs related to the workings of the One Identity Safeguard for Privileged Analytics module.
- logadapter: Logs of the log adapter plugin(s) and syslog instance(s) configured for ingesting logs from an external source.
-
http: Logs of the HTTP connections passing through SPS.
-
ica: Logs of the ICA connections passing through SPS.
-
rdp: Logs of the RDP connections passing through SPS.
-
ssh: Logs of the SSH connections passing through SPS.
-
telnet: Logs of the Telnet connections passing through SPS.
-
vnc: Logs of the VNC connections passing through SPS.
-
Use the buttons at the bottom of the dialog to perform the following tasks:
-
To download the log file, click Download.
-
To follow the current log messages real-time, click Tail.
-
To display the log messages, click View.
-
To display log messages of the last seven days, select the desired day from the Day field and click View.
TIP: To display only the messages of a selected host or process, enter the name of the host or process into the Show only messages containing field.
The Show only messages containing field acts as a generic filter: enter a keyword or a regular expression to display only messages that contain the keyword or match the expression.


