Editing the report form
You can create and edit reports in the edit view of the Report Editor. The Stimulsoft Reports.Ultimate Report Designer is integrated into the edit view. You can find accurate descriptions and the functionality of individual components in the Stimulsoft online help (www.stimulsoft.com).
NOTE: When you start the Report Editor for the first time, you can select the configuration type (basic, default or professional) for the report. The configuration type determines the range of properties displayed when editing a report. You can change the configuration type later in the edit view using the context menu in the property view.
The following functions are appended to the Stimulsoft Reports.Ultimate Report Designer toolbar:
Table 165: Extensions to Stimulsoft Reports.Ultimate Report Designer toolbar
|

|
Imports a reports (XML format). |
|

|
Export a report (XML format). |
|

|
Globalization editor. Opens the Report Designer globalization editor. |
|

|
Opens the Translate texts dialog. |
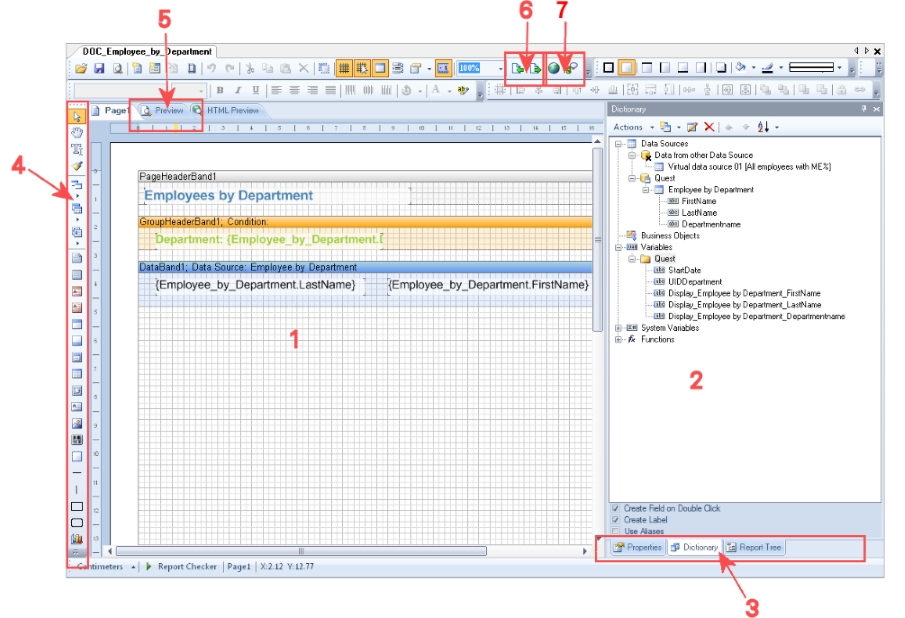
Figure 34: Report Designer with report form (1), dictionary/properties view (2), tabs for swapping between dictionary/properties (3), toolbox (4), preview (5), import/export of report pages (6), translate report (7)
Detailed information about this topic
Adding data fields to report forms
Add the control elements for the data you want to appear in the report on the report form and link the them to the data source columns. After you have created the data sources, they are listed with all the columns used in the Report Designer’s dictionary under Quest. The report parameters are available as variables under Quest.
You can find accurate descriptions and the functionality of individual components in the Stimulsoft online help (www.stimulsoft.com).
To insert data boxes into the report form
-
Select the column you want to add to the report in the Dictionary tab.
-
Position the column on the report form using "drag and drop".
This creates a new control element on the report form which includes some predefined variables.
TIP: You can add other control elements as necessary with the Report Designer tool palette.
-
The Report Designer properties window (Properties) allows you to customize individual control elements.
-
Use Preview to view the report during editing. The preview takes some sample parameter values to determine the data for the preview display.
Related topics
Tips for entering dates in reports
If no date is given, the date 12/30/1899 is used internally. Take this into account when values are compared, for example, when used in reports.
To display a string other than the internal date 12/30/1899, you have the following options:
-
For data sources in the SQL query module, change the date conversion in the data source.
Example:
select ISNULL(convert(varchar, Person.ExitDate, 121), '-') as date_substituted
-
Change the expression for displaying the date columns when you create the report form.
Example:
{IIF(Person.ExitDate.ToString() = "12/30/1899 12:00:00 AM","-",Person.ExitDate)}
-
Define a condition for displaying the date columns when you create the report form.
In the Report Designer, add conditions to toolbar using the  icon.
icon.
Example of a simple report with data grouping
We want to create a report that lists all employees as grouped in their respective departments.
- A new report is created.
-
The report is given the name CCC_Employee_by_Department. The display name defined is Employees by Department %UID%.
- A data source (Employee by Department) is created for the report with the SQL
query module. The data query should return the employees assigned to a department. The department is found with the object key (XObjectKey). This is passed as a parameter to the report. The employee‘s first name (firstname), last name (lastname) and department name (departmentname) are queried.
Select Firstname, Lastname, Departmentname
from person join Department
on person.uid_Department = department.uid_Department
where Department.XObjectKey = @UIDDepartment
-
This adds the UIDDepartment parameter to the report. It is populated with a sample value for the preview.
-
The control elements for the database columns are arranged on the report form.
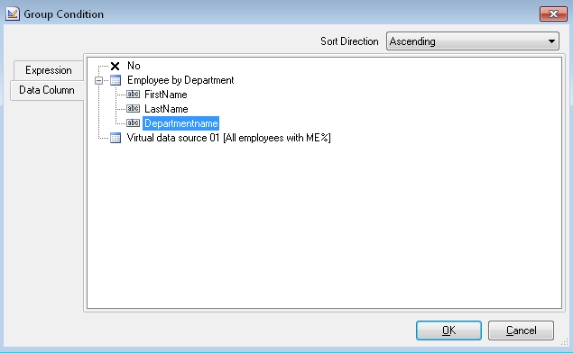
For data grouping, add a band of the Group header type from the Report Designer’s toolbox to the report form. The column name used for grouping must be entered as a grouping condition. In the example, this is Departmentname.
Figure 35: Specifying the grouping condition
-
Drag and drop the Departmentname column from the Report Designer‘s dictionary (Dictionary tab) into the group header. This creates a new control element on the report form.
Figure 36: Creating a group

-
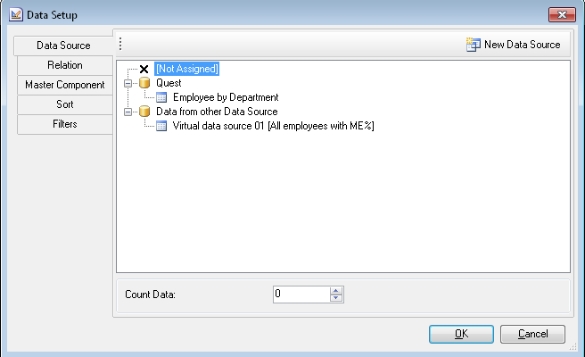
To display employees, add a Data band to the report form from the Report Designer‘s toolbox. Specify the data source as Employee by Department.
Figure 37: Specify the data source
-
Drag and drop the Lastname and Firstname columns from the Report Designer‘s dictionary (Dictionary tab) to the data band. This creates the respective control elements on the report form.
Figure 38: Organizing control elements on a report form

-
Other control elements such as a title (PageHeader) can be added as necessary with the Report Designer. The Report Designer Properties window allows you to customize individual control elements.
-
The preview can be used to view the report during setup. The preview uses the sample parameter values in the parameter view of the report edit dialog to determine the data for this.
Detailed information about this topic
