Safe Mode
Active Roles provides a troubleshooting option, referred to as safe mode, which starts the Administration Service in a limited state. When safe mode is enabled, the Administration Service disregards the following:
- Custom policies
- Workflows
- Scripts
- Scheduled tasks
- Other customizations that may block Active Roles from starting and operating normally, and rejects connections from any user other than an Active Roles Admin.
Active Roles Admin can connect to the Administration Service and make changes in order to fix or remove customizations that cause issues, and then disable safe mode.
How to use Safe Mode
- Log on to the computer running the Administration Service with a user account that has administrator rights on that computer.
|

|
NOTE: Local administrator rights are required to enable or disable safe mode. |
- Open Active Roles Management Shell on the computer running the Administration Service.
- Click Active Roles Management Shell on the Apps page or Start menu depending upon the version of the Windows operating system.
- To enable safe mode, enter the following commands at the Management Shell command prompt:
- Set-ARService -SafeModeEnabled $true
- Restart-ARService
- To disable safe mode, enter the following commands at the Management Shell command prompt:
- Set-ARService -SafeModeEnabled $false
- Restart-ARService
Error and Log resources
Active Roles writes most events to its own Event log in Windows Event Viewer, under Applications and Services, called Active Roles Admin Service.
This event log can be used to help determine root causes for issues and typically provide more detailed error information if any issues are encountered within the console or Web Interface.
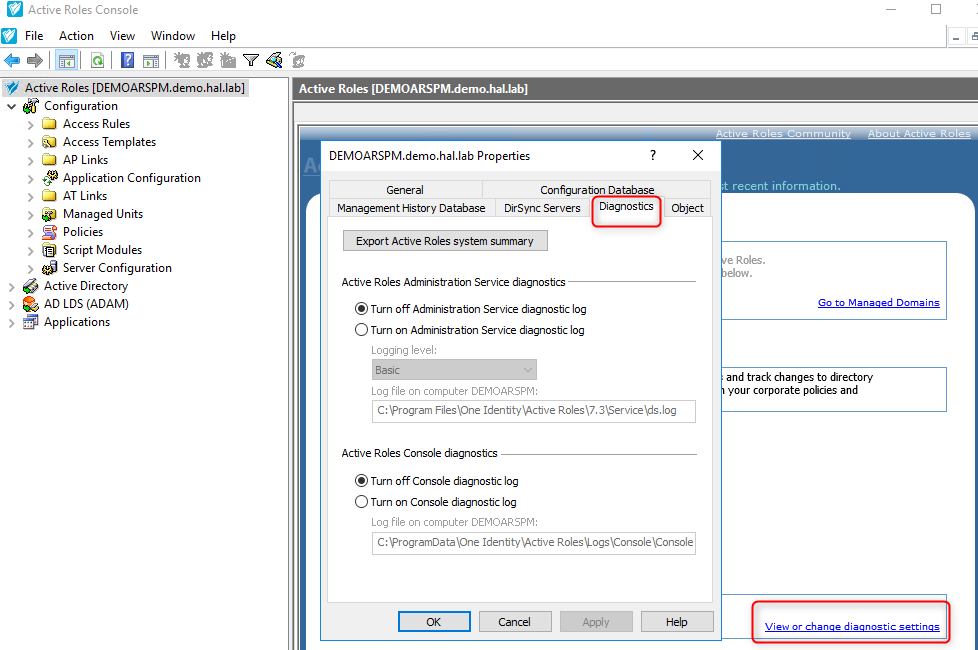
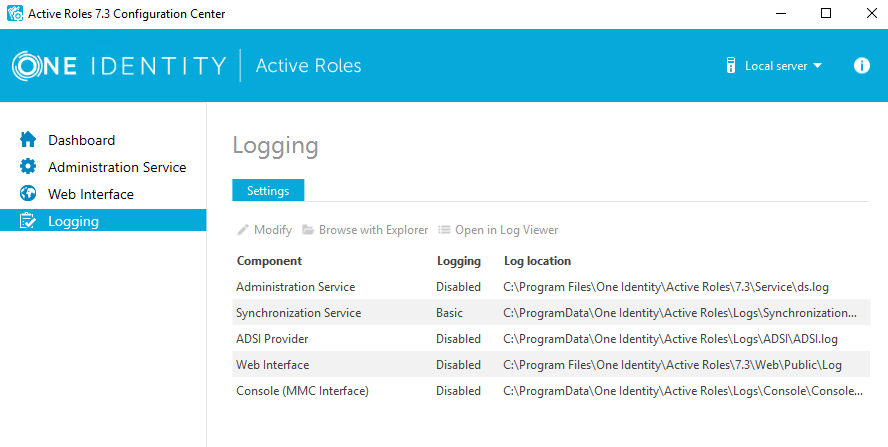
In addition to the Event log, there is a debug option for the Active Roles Administration service that is disabled by default. Enabling logging can be accessed either in the Active Roles MMC Console or via the Active Roles Configuration Center.
In addition to the Synchronization Center, the ADSI provider and MMC (console), it is recommended to use the Active Roles Configuration Center as it provides options to enable logging for the Web Interface component. The Log Viewer can then be launched directly from here for any of these logs.
Figure 3: Active Roles Console

Figure 4: Active Roles Configuration Center

In versions earlier to Active Roles 7.0, after the logs are generated, the logs are sent to One Identity Support for analysis as the logs on their own can be difficult to read.
With Active Roles 7.0 we have provided a new tool called the Active Roles Log Viewer, which breaks down the log to a simple and readable format so that customers can review the logs on their own before engaging One Identity Support.
Active Roles Log viewer
The Log Viewer tool provides the ability to browse and analyze diagnostic log files created by the Active Roles Administration Service, as well as event log files created by saving the Active Roles event log in Event Viewer on the computer running the Administration Service. Log Viewer helps to study the sequence or hierarchy of requests processed by the Administration Service, identify error conditions that the Administration Service encountered during request processing, and find Knowledge Articles that apply to a given error condition.
With Log Viewer, both Active Roles diagnostic log files (ds.log) or saved event log files (.evtx) can be opened, and the following can be viewed:
- Errors encountered by the Administration Service and recorded in the log file
- Requests processed by the Administration Service and traced in the log file
- All trace records found in the diagnostic log file
- All events found in the event log file
Select an error in the list, and choose a command to look for the solution in Knowledge Base. The command performs a search in One Identity Software Knowledge Base to list the Knowledge Articles that can provide helpful information on how to troubleshoot the selected error. Log Viewer can be used to:
- Search the list for a particular text string, such as an error message
- Filter the list by various conditions, to narrow the set of list items of interest
- View detailed information about each list item, such as error details, request details or stack trace
Log file size
The logs grow in size quickly. Therefore, it is recommended to enable logging right before and disable logging immediately after the issue has been reproduced.
The file captures any activity being performed by the service, including the tasks performed by connected users while debug logging is enabled.
In some scenarios, it may be required to leave the logging on for a specific period of time. Due to the logs getting stored on the computer running Active Roles, sufficient hard drive space may not be available. In this event, the following solution can help to set logging for a specific interval and move the logs to another drive or network share:
- How to automate Active Roles logging (debug):
https://support.oneidentity.com/kb/8617
For the Web Interface, there is a separate log file,<name of Site>.log.
The default Location of the Web Interface log is here:
C:\Program Files\One Identity\Active Roles\7.4\Web\Public\Log
As with the ds.log file, the Web Interface log can grow quickly as well. It is recommended to turn it on while reproducing an issue only.
Replication
For a video demonstration, please refer to the following knowledge base article:
https://support.oneidentity.com/kb/234198
For additional information and troubleshooting, please refer the latest Active Roles Administration Guide.


