Network troubleshooting
The Troubleshooting menu provides a number of diagnostic commands to resolve networking issues. Logfiles of SSB can also be displayed here — for details, see Viewing logs on SSB.
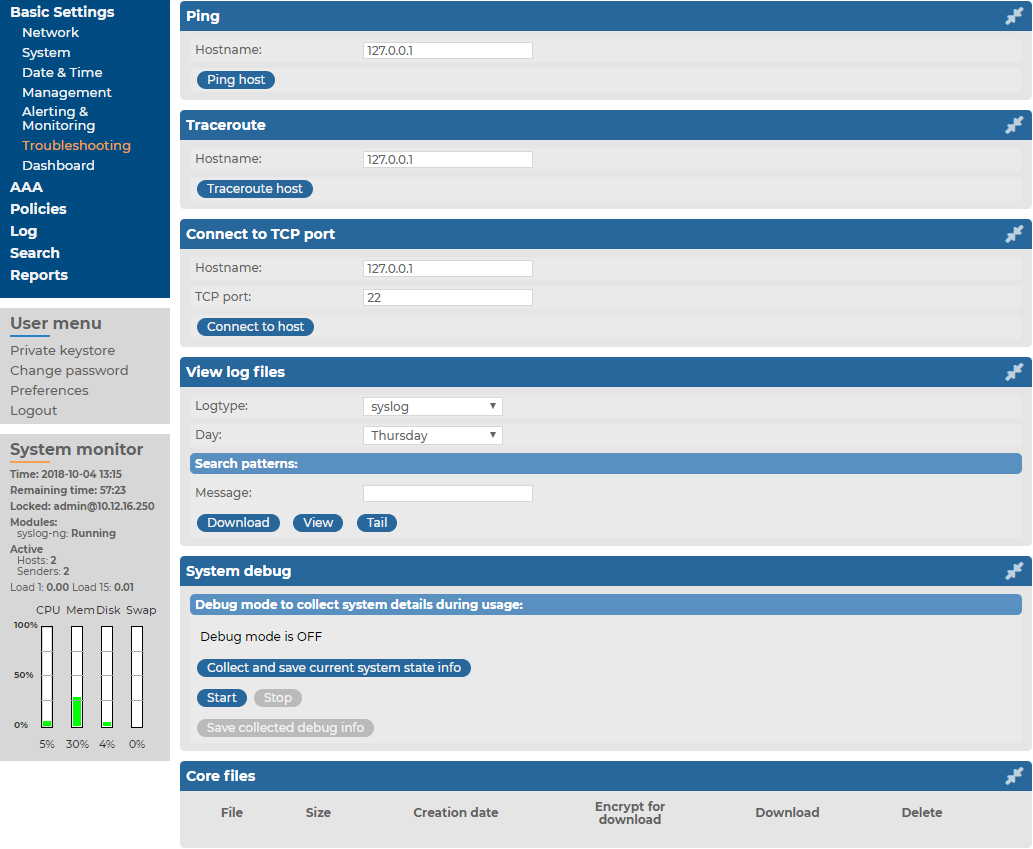
Figure 165: Basic Settings > Troubleshooting > System debug — Network troubleshooting with SSB
The following commands are available:
-
ping: Sends a simple message to the specified host to test network connectivity.
-
traceroute: Sends a simple message from SSB to the specified host and displays all hosts on the path of the message. It is used to trace the path the message travels between the hosts.
-
connect: Attempts to connect the specified host using the specified port. It is used to test the availability or status of an application on the target host.
To execute one of the above commands
-
Navigate to Basic Settings > Troubleshooting.
-
Enter the IP address or the hostname of the target host into the Hostname field of the respective command. For the Connect command, enter the target port into the Port field.
-
Click the respective action button to execute the command.
-
Check the results in the popup window. Log files are displayed in a separate browser window.
Gathering data about system problems
SSB automatically generates core files if an important software component (for example, syslog-ng, or the indexer) of the system crashes for some reason. These core files can be of great help to the One Identity Support Team to identify problems. To display a list of alerts, navigate to Search > Log Alerts.
To list and download the generated core files, navigate to Basic Settings > Troubleshooting > Core files.
By default, core files are deleted after 14 days. To change the deletion timeframe, navigate to Basic Settings > Management > Core files.
Viewing logs on SSB
The Troubleshooting menu provides an interface to view the logs generated by the various components of SSB. For details on how to browse the log messages received by SSB from its peers, see Searching log messages.
|

|
NOTE:
Because of performance reasons, log files larger than 2 Megabytes are not displayed in the web interface. To access these logs, download the file instead. |
To view logs on SSB
-
Navigate to Basic Settings > Troubleshooting > View log files.
-
Use the Logtype roll-down menu to select the message type.
-
SSB: Logs of the SSB web interface.
-
syslog: All system logs of the SSB host.
-
syslog-ng: Internal log messages of the built-in syslog-ng server. These logs do not contain messages received from the peers.
-
-
To download the log file, click Download.
-
To follow the current log messages real-time, click Tail.
-
To display the log messages, click View.
-
To display log messages of the last seven days, select the desired day from the Day: field and click View.
|
|
TIP:
To display only the messages of a selected host or process, enter the name of the host or process into the Message: field.
The Message: field acts as a generic filter: enter a keyword or a POSIX (basic) regular expression to display only messages that contain the keyword or match the expression. |
Collecting logs and system information for error reporting
To track down support requests, the One Identity Support Team might request you to collect system-state and debugging information. This information is collected automatically, and contains log files, the configuration file of SSB, and various system-statistics.
|
|
NOTE:
Sensitive data like key files and passwords are automatically removed from the files.
The Basic Settings > Management > Debug logging > Enable debug logs option is not related to the verbosity of log messages: it adds the commands executed by the SSB web interface to the log. |
To collect system-state information, navigate to Basic Settings > Troubleshooting > System debug and click Collect and save current system state info, then save the created zip file. The name of the file uses the debug_info-<hostname>YYYYMMDDHHMM format.
To collect information for a specific error
-
Navigate to Basic Settings > Troubleshooting > System debug.
Figure 166: Basic Settings > Troubleshooting > System debug — Collecting debug information
-
Click Start.
|
|
NOTE:
Starting debug mode increases the log level of SSB, and might cause performance problems if the system is under a high load. |
-
Reproduce the event that causes the error, for example send a log message from a client.
-
Click Stop.
-
Click Save the collected debug info and save the created zip file. The name of the file uses the debug_info-<hostname>YYYYMMDDHHMM format.
-
Attach the file to your support ticket.
