Analyzing data changes in reports and the TimeTrace
In reports and in the TimeTrace, an analysis is carried out of the data changes saved in the One Identity Manager database and those stored in a One Identity Manager History Database. You can use this to find out who had what permissions at which point in time.
Figure 1: Analyzing data changes
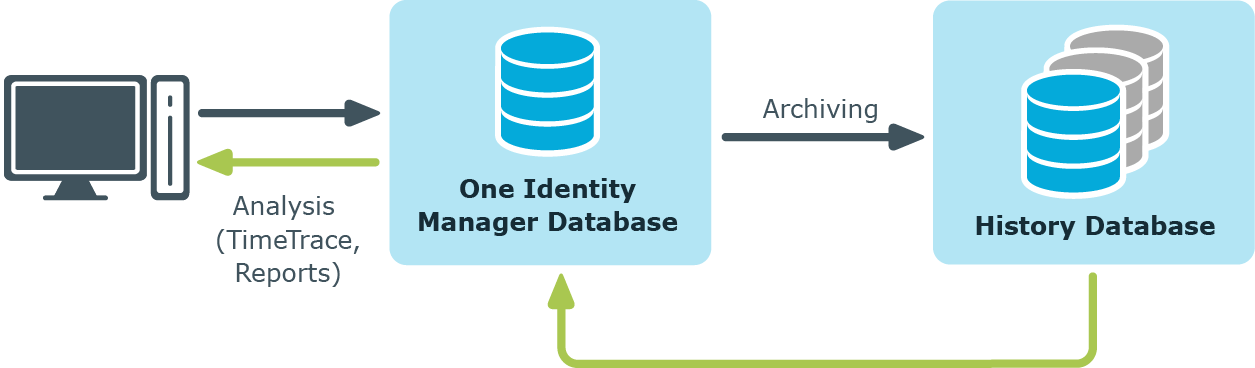
Prerequisite for analyzing historical data in reports and in the TimeTrace is the recording of data changes within process monitoring. Data changes that are saved in the One Identity Manager database, can be immediately included in the analysis. To use archived data, the One Identity Manager History Database must be declared in the One Identity Manager database.
Prerequisites for analyzing data changes
-
The Common | ProcessState configuration parameter is set and a method for recording the data changes with process monitoring is configured.
For more detailed information about logging changes to data, see the One Identity Manager Configuration Guide.
-
To access archived data in the TimeTrace and in reports, the One Identity Manager History Database must be declared in the One Identity Manager database.
For more information about declaring the One Identity Manager History Database and archiving data, see the One Identity Manager Data Archiving Administration Guide.
-
To display the TimeTrace view in the Manager, users require the Option to show the TimeTrace (Common_TimeTrace) program function.
-
To evaluate of the effectiveness of the assignments (XIsInEffect column) in reports, in the Designer check the Common | ProcessState | PropertyLog | ShowEffectiveAssignmentsOnly configuration parameter and change it if necessary.
-
To display only the effective assignments when evaluating historical assignments in reports, set the configuration parameter (default).
-
To show all assignments as effective, regardless of their effectiveness, do not set the configuration parameter.
NOTE: The effectiveness of assignments (XIsInEffect column) is logged in the history as of One Identity Manager version 8.1.5. Older assignment data is always presented as effective, regardless of its actual effectiveness.
Related topics
Displaying change information in the Manager's TimeTrace
NOTE: To display the TimeTrace view in the Manager, users require the Option to show the TimeTrace (Common_TimeTrace) program function.
To display an object's change data:
-
In the Manager, open the time trace using the View > TimeTrace menu item.
-
Select the object whose change information you want to display.
-
Activate the change history for this object in the TimeTrace view using the  button.
-
In the TimeTrace view, use the  (time range) filter in the toolbar to specify the time range for which the change information is loaded. The changes are determined from the One Identity Manager database and the connected One Identity Manager History Database databases.
All change time stamps in the time frame that has been loaded are now shown in the overview below the timeline.
NOTE: To display changes of assignments to an object, such as the employee assignment to a department or a resource assignment to an organization, select the relevant assignment form in the task view of the Manager. In the TimeTrace view, you can then also select a source for which to display the changes. An additional Source menu is offered, in which you can select the respective assignment or the base object.
To select a change time stamp on the timeline:
-
To display a part of the timeline in greater detail, click a marking below the timeline.
-
Each change time stamp has a label showing the date and time. There is a tooltip for each change, showing which items of data were changed and by whom.
-
Select a change time stamp on the timeline or on the label.
-
If there are multiple change time stamps which are very close together, when you select a time stamp a context menu appears from which you can choose the specific change time stamp.
-
Click the timeline or Ctrl + mouse wheel to zoom in or zoom on the display of several time change stamps that are close together.
When you select a change time stamp in TimeTrace, the program's document view opens the object's main data form or the assignment form. Use the timeline or quick edit a label to choose if you want the object settings or assignments to be displayed in the main data form before or after the changes have been made.
If a property of an object shows a historical value, it is marked by an icon. A tooltip shows the current value of the property. Use the Show property change history context menu to display the recorded data for this property.
You can apply historical data to the current object and restore the object to the status prior to the change.
To apply the historic values:
-
Click the icon in front of the modified property. The following information is displayed.
-
Property: These properties are changed once the historical value is transferred. The changes are made immediately or by templates.
-
New value: Value of the property after the historical value has been saved.
-
Old value: Current value of the property. This value is overwritten once the historical value is saved.
- Click Save.
The Info system in the Manager
The Manager‘s info system provides data about the health of the system in the form of diagrams.
-
Topic-specific statistics and cross-functional statistics are displayed on the Manager home page.
-
Within each category, topic-specific statistics are displayed under Info system.
-
Topic-specific statistics for all categories are displayed in the My One Identity Manager category.
Statistics definitions form the basis of the info system. These are created centrally. For more information about creating statistics definitions, see the One Identity Manager Configuration Guide.
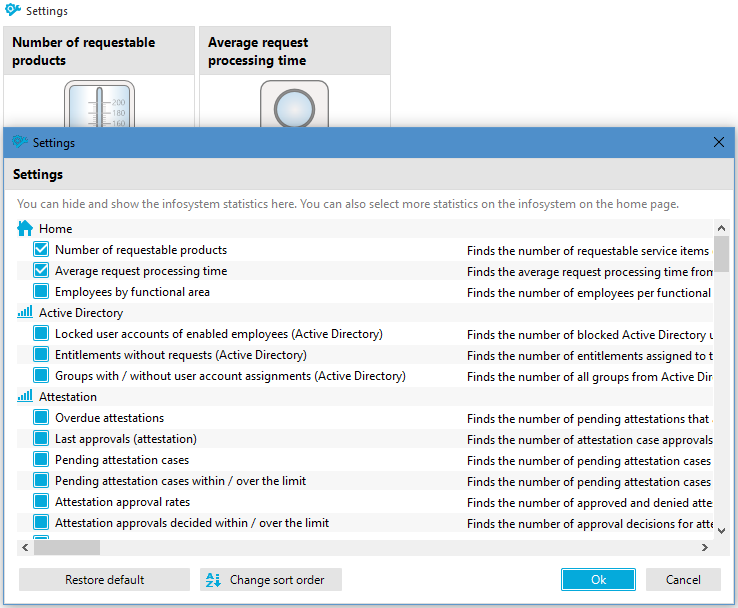
Every user can set which statistics they want to see and in which order. Use the settings to do this. The changes are saved to the user configuration so that the last setting used is shown when the program is restarted.
All the available statistics are grouped by topic in the settings. Each statistic has a title and a description.
To select statistics for display
-
Show the statistics and click Settings.
-
Enable or disable statistics by clicking the button in front of the name of the statistics.
To restore the default setting, click Restore default.
-
Click OK.
Figure 2: Statistics settings
To change the order in which statistics are displayed:
-
Display the statistics and select Settings.
-
Click Change sort order.
-
Select the statistic that you wish to move. You can select multiple statistics using Shift + select or Ctrl + select.
-
Move the selected statistics with the arrow keys.
Table 7: Meaning of the buttons for changing the sort order.
|

|
Moves the selected statistics up. |
|

|
Moves the selected statistics down. |
-
To restore the default setting, click Restore default.
-
Click OK.
- OR -
If you wish to make more changes, go back to the Assignment view.
Detailed information about this topic
Diagram types in the info system
There are several diagram types available for visualizing statistics.
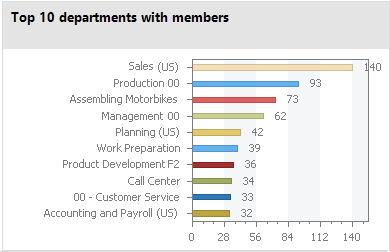
Bar chart
A bar chart can be used to visualize comparisons between measurements.
Figure 3: Bar chart example
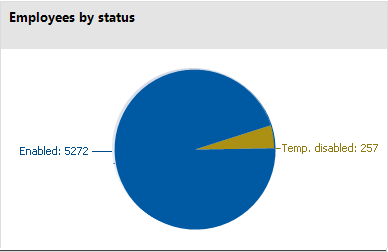
Pie chart
A pie chart can be used to visualize the measurements as a percentage of the base measurement.
Figure 4: Pie chart example
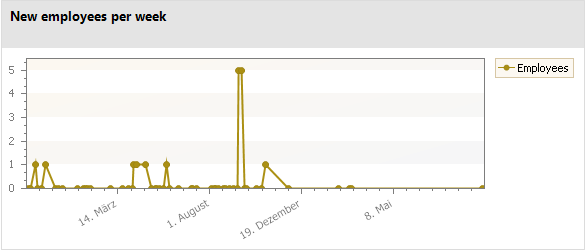
Line diagram
A line diagram can be used to visualize a data sequence over a specified time period. Click with the mouse on a point of measurement and a tooltip showing the measurement is displayed.
Figure 5: Line diagram example
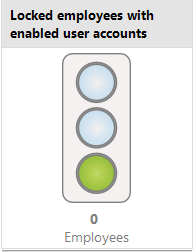
Traffic light
A traffic light diagram can be used to visualize the state of the system. The state is indicated by the color.
Table 8: Meaning of the colors
|
Green |
correct |
|
Yellow |
acceptable |
|
Red |
unacceptable |
Figure 6: Traffic light example
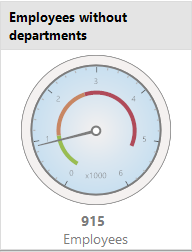
Tachometer
A tachometer diagram can be used to visualize the state of the system in more detail than in a traffic light diagram. The base measurement is also displayed. The state is indicated by the color.
Figure 7: Tachometer diagram example
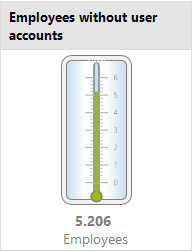
Thermometer
A thermometer diagram can be used to visualize the state of the system in more detail that in a traffic light diagram. The state is indicated by a color scale on the side of the diagram.
Figure 8: Thermometer diagram example
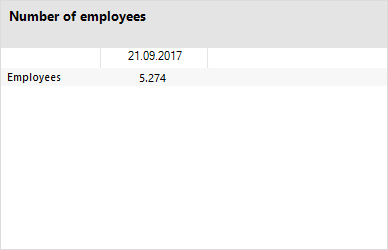
Table
Choose this diagram type to display the measurements or measurement trends over a certain timeframe in tabular format.
Figure 9: Table example