This section describes the HTTP connection settings for your Splunk destination.
After you have set the transport settings for the Splunk destination, and selected the HTTP transport type, you can configure the following:
Figure 165: Log > Destinations > <your-splunk-destination> Transport > HTTP > HTTP connection settings - Configuring the HTTP connection settings for your new Splunk destination
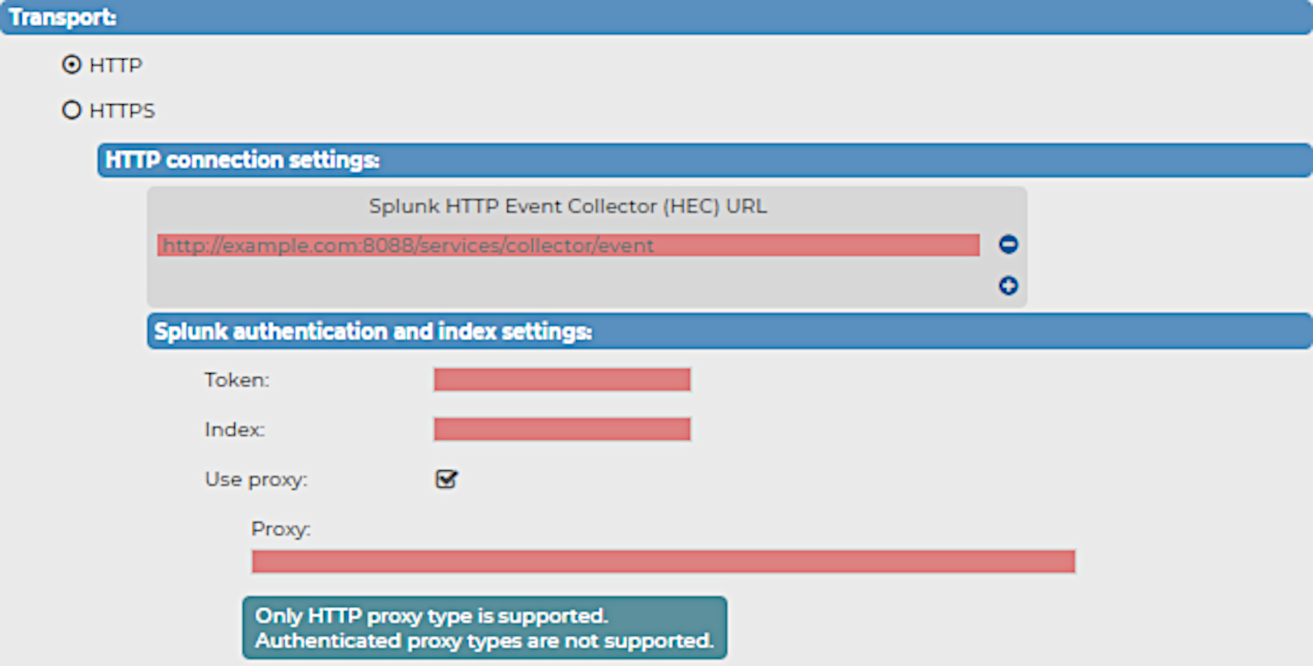
The Splunk HTTP Event Collector (HEC) URL
When configuring the HTTP or HTTPS connection settings for your Splunk destination for syslog-ng Store Box (SSB), you have to configure the HTTP Event Collector (HEC) URL first.
To configure the Splunk HEC URL for your Splunk destination
-
Navigate to Log > Destinations > <your-splunk-destination>.
-
Select the Transport type you want to use (HTTP or HTTPS).
-
Under HTTP connection settings or HTTPS connection settings (depending on your Transport type), enter the Splunk HTTP Event Collector (HEC) URL of your choice.
NOTE: IPv6 addresses are not supported.
Splunk authentication and index settings
After setting the transport settings, and then configuring the Splunk HEC URL for your Splunk destination, you have to configure your Splunk authentication and index settings.
To configure your Splunk authentication and index settings
-
Copy the Splunk HTTP Event Collector token provided by your Splunk deployment into the Token field.
Because the Splunk HTTP Event Collector token permits SSB to send messages to Splunk, configuring the Token field is required for the Splunk destination.
For details about setting up and using the Splunk HTTP Event Collector token on your Splunk deployment, see Set up and use HTTP Event Collector in Splunk Web.
-
Enter the name of the Splunk index where Splunk will store the messages received from SSB into the Index field.
Configuring the Index field is required for the Splunk destination.
-
(Optional) Enable Use proxy to use a proxy address while forwarding messages to your Splunk deployment.
NOTE: When configuring your proxy address, consider the following:
This section describes the HTTPS connection settings for your Splunk destination.
After you have set the transport settings for the Splunk destination, and selected the HTTPS transport type, you can configure the following:
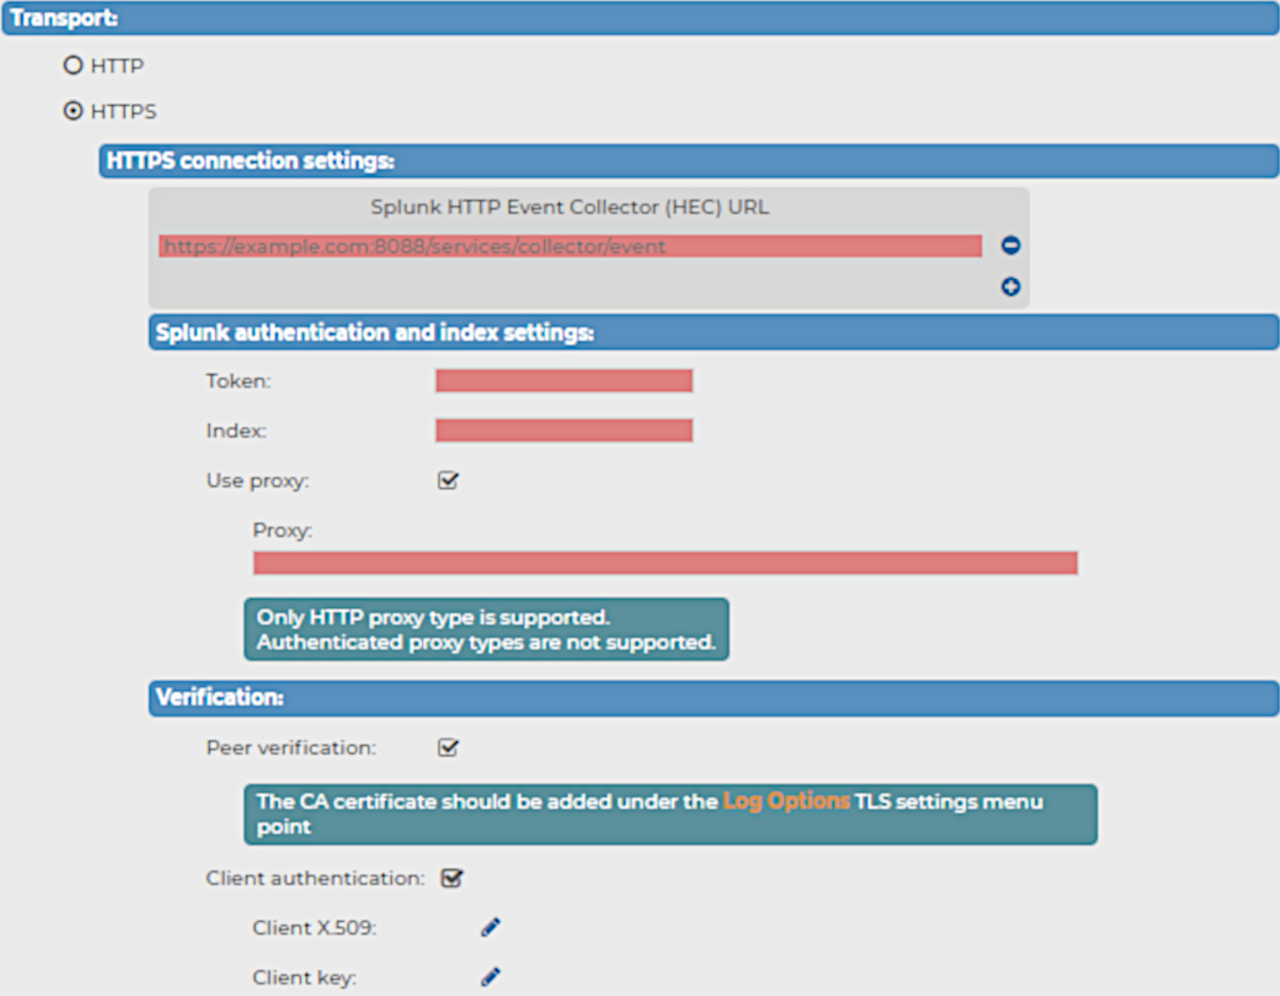
Figure 166: Log > Destinations > <your-splunk-destination> Transport > HTTPS > HTTPS connection settings - Configuring the HTTPS connection settings for your new Splunk destination
The Splunk HTTP Event Collector (HEC) URL
When configuring the HTTP or HTTPS connection settings for your Splunk destination for syslog-ng Store Box (SSB), you have to configure the HTTP Event Collector (HEC) URL first.
To configure the Splunk HEC URL for your Splunk destination
-
Navigate to Log > Destinations > <your-splunk-destination>.
-
Select the Transport type you want to use (HTTP or HTTPS).
-
Under HTTP connection settings or HTTPS connection settings (depending on your Transport type), enter the Splunk HTTP Event Collector (HEC) URL of your choice.
NOTE: IPv6 addresses are not supported.
Splunk authentication and index settings
After setting the transport settings, and then configuring the Splunk HEC URL for your Splunk destination, you have to configure your Splunk authentication and index settings.
To configure your Splunk authentication and index settings
-
Copy the Splunk HTTP Event Collector token provided by your Splunk deployment into the Token field.
Because the Splunk HTTP Event Collector token permits SSB to send messages to Splunk, configuring the Token field is required for the Splunk destination.
For details about setting up and using the Splunk HTTP Event Collector token on your Splunk deployment, see Set up and use HTTP Event Collector in Splunk Web.
-
Enter the name of the Splunk index where Splunk will store the messages received from SSB into the Index field.
Configuring the Index field is required for the Splunk destination.
-
(Optional) Enable Use proxy to use a proxy address while forwarding messages to your Splunk deployment.
NOTE: When configuring your proxy address, consider the following:
Verification
After setting the transport settings, configuring the Splunk HEC, then configuring your Splunk authentication and index settings, you can configure your verification settings for your Splunk destination.
NOTE: Both Peer verification and Client authentication are optional. If you want to use Peer verification for your Splunk destination, consider that the CA certificate must be added under Log > Options > TLS settings before you enable the Peer verification option.
To configure the verification settings for your Splunk destination
-
Navigate to Log > Destination > <your-splunk-destination> > Transport > HTTPS connection settings > Verification.
-
(Optional) To use the CA certificate that you previously added under Log > Options > TLS settings, enable Peer verification.
-
(Optional) To use the client authentication method for verification, enable Client authentication, and add your Client X.509 certificate and your Client key.
When configuring your Splunk destination for syslog-ng Store Box (SSB), you have to configure JSON message body settings after you finish configuring the Transport settings for the Splunk destination.
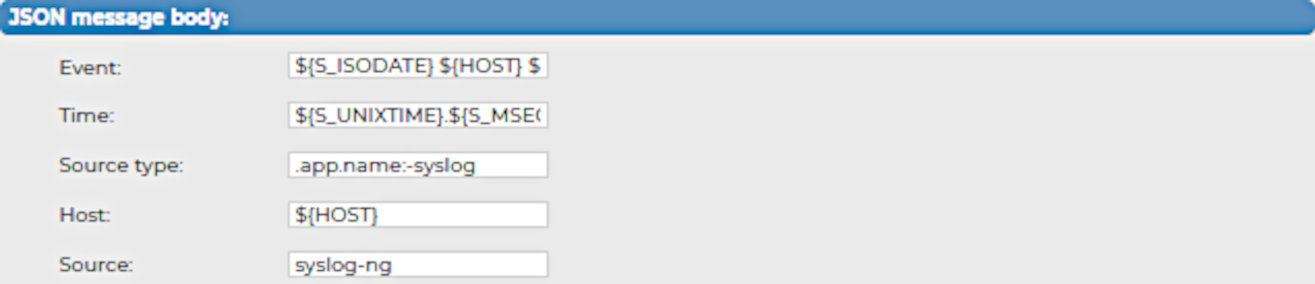
Figure 167: Log > Destinations > <your-splunk-destination> - Configuring the JSON message body for your new Splunk destination
To configure the JSON message body settings for your Splunk destination
-
In the Event field, specify the body of the message that SSB sends to your Splunk deployment.
NOTE: SSB sends the contents of the message body (which will be identical to the value of the ${MSG} macro in a syslog-ng PE configuration) to your Splunk deployment in JSON format.
Default syntax: ${S_ISODATE} ${HOST} ${MSGHDR}${MSG}\n
-
In the Time field, specify the timestamp for the message that SSB sends to your Splunk deployment.
Default syntax: ${S_UNIXTIME}.${S_MSEC}
-
In the Source type field, specify the same source type that you configured on your Splunk deployment for the Splunk token assigned to this SSB destination.
Default syntax: .app.name:-syslog
For details about source types, see Why source types matter in the Splunk online documentation.
-
In the Host field, specify the hostname for the message that SSB sends to your Splunk deployment.
NOTE: On your Splunk deployment, the message will appear as it is sent by the host specified in this field.
Default syntax: ${HOST}
-
In the Source field, enter the value of the source field configured on your Splunk deployment into the Source field.
Default value on Splunk deployments: syslog-ng.
When configuring your Splunk destination for syslog-ng Store Box (SSB), you have to configure the performance-related settings after you finish configuring the JSON message body settings for the Splunk destination.
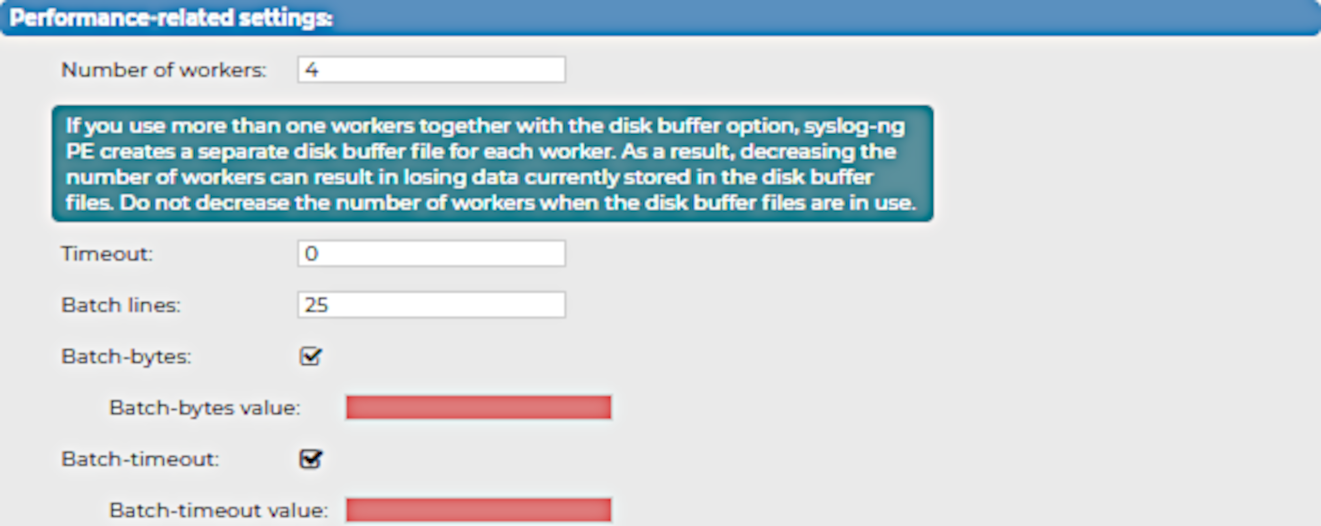
Figure 168: Log > Destinations > <your-splunk-destination> - Configuring the Performance-related settings for your new Splunk destination
To configure the performance-related settings for your Splunk destination
-
Specify the Number of workers that you want SSB to use when sending messages to the server.
|

|
CAUTION: Hazard of data loss!
When you use more than one worker threads together with disk-buffering enabled, consider that the syslog-ng PE application behind SSB creates a separate disk-buffer file for each worker thread. This means that decreasing the number of workers can result in losing data currently stored in the disk-buffer files. To avoid data loss, One Identity recommends that you do not decrease the number of workers when the disk-buffer files are in use. |
NOTE: Increasing the number of worker threads can drastically improve the performance of the destination.
-
Specify the Timeout (in seconds) that you want SSB to wait for an operation to complete, and attempt to reconnect the server if the configured timeout limit is exceeded.
-
In the Batch lines field, specify how many lines you want SSB to flush to a destination in one batch.
NOTE: SSB waits for the configured number of lines to accumulate, and when this number is reached, SSB sends the message lines to the destination in a single batch. For example, if you set Batch lines to 100, SSB waits for 100 message lines before sending them in one batch.
Consider the following when configuring the number of batch lines:
-
Increasing the number of batch lines increases throughput (because more messages are sent in a single batch), but also increases message latency.
-
If Batch-timeout option is disabled, the syslog-ng PE application behind SSB flushes the messages if it has sent the number of messages specified in Batch lines, or the queue became empty. If you stop or reload the syslog-ng PE application behind SSB, or if in case of network sources, the connection with the client is closed, the syslog-ng PE application behind SSB automatically sends the unsent messages to the destination.
-
If the Batch-timeout option is enabled and the queue becomes empty, SSB flushes the messages only if Batch timeout expires, or the batch reaches the limit set in Batch lines.
NOTE: Depending on your source configuration settings, your batch may not reach the Batch lines limit before your queue becomes empty, and SSB forwards your messages.
-
(Optional) Select Batch-bytes, and in the Batch-bytes value field, set the maximum size of payload in a batch (in bytes).
NOTE: When configuring Batch-bytes, consider the following:
-
If the size of the messages reaches this value, the syslog-ng PE application behind SSB sends the batch to your Splunk deployment even if the number of messages is less than the value you configure in the Batch-bytes field.
-
Consider that if Batch-timeout is enabled and the queue becomes empty, SSB flushes the messages only if Batch-timeout value expires, or if the message batch reaches the limit set in the Batch-bytes field.
-
(Optional) Select Batch-timeout, and in the Batch-timeout value field, specify the time SSB waits for Batch lines to accumulate in the output buffer.
SSB sends batches to the destinations evenly. The timer starts when the first message arrives to the buffer, so if only few messages arrive, SSB sends messages to the destination once every Batch timeout milliseconds at most.
