Once content-based alerts have been created, syslog-ng Store Box(SSB) will send alert messages to the configured targets.
The alert email's subject line will follow this format:
Alert: [myalert][mylogspace]
Alert messages will be presented in the following format:
Alert: There were at least 10000 matches between Mon 18 Apr 2016 10:45:38 CEST and Mon 18 Apr 2016 10:45:43 CEST on
 * logspace: "<mylogspace>"
 * alert: "<myalert>"
 * search expression: "<mysearchexpression>"

To review these matches on your SSB appliance, see:
https://<IP_address_of_SSB>:<port_number>/index.php?_backend=SearchLogspace#logspace_name=mylogspace&
from=1460976338&to=1460976343&search_expression=mysearchexpression

Note: You will not receive a new alert message for a cooldown period of 1 minute for this alert.
Note that the contents of the log messages are not shared in the alert message. A URL is provided to direct users to their SSB appliance.
The syslog-ng Store Box(SSB) appliance provides additional tools to obtain information about log messages that can come from external sources. They are as follows:
-
Pattern database: You can use the pattern database of SSB to alert on certain log messages. If you are using the pattern database for such purposes and you wish to check the history of the alerts raised by SSB, then refer to Log message alerts.
-
Reports: SSB periodically creates reports on processed traffic. If you wish to retrieve information available in such reports, see Reports.
Searching the internal messages of SSB
The syslog-ng Store Box(SSB) appliance allows you to search, filter, and export internal messages. These internal messages contain the logs created by SSB itself (not the messages collected from external sources), including log messages of the SSB appliance, configuration changes, notifications, alerts, and dashboard statistics.
Log messages of the SSB appliance:
-
All available log messages are listed in the local logspace in Search > Logspaces.
For detailed instructions on using the log search interface, see Using the search interface.
-
Recent log messages are also available in Basic settings > Troubleshooting.
For detailed instructions on using the troubleshooting tools, see Troubleshooting SSB.
Configuration changes:
-
The configuration-related activity of SSB users and administrators is available at AAA > Accounting. The configuration changes performed on the SSB web interface are all listed here.
For the list of displayed parameters, see Changelogs of SSB.
-
Peers (client computers) that use syslog-ng Premium Edition 3.0 or newer send a special log message to SSB when their configuration is modified. These changes are listed at Search > Peer configuration change.
For the list of displayed parameters, see Configuration changes of syslog-ng peers.
Alerts and notifications:
-
If you use the pattern database of SSB to alert on certain log messages, then a history of the alerts is available at Search > Alerts.
For the list of displayed parameters, see Log message alerts.
-
Backup and archive notifications, including errors encountered during backup or archiving, are stored at Search > Archive & Cleanup.
For the list of displayed parameters, see Notifications on archiving and backups.
Dashboard statistics and reports:
-
The statistics of SSB are available at Basic settings > Dashboard.
For detailed information and the list of available options, see Status history and statistics.
-
PDF reports about the configuration changes, system health parameters, and other activities of SSB are available at Reporting > Reports.
For the list of displayed parameters, see Reports.
The internal search interfaces that allow you to browse and filter the configuration changes, alerts, notifications, and reports of syslog-ng Store Box(SSB) are located across various pages. The way the user interface works, however, is uniform across all these pages. This section walks you through the main functionalities that are available to you when browsing internal messages.
The example in AAA > Accounting — An example of an internal search interface shows the AAA > Accounting page but all the search interfaces listed under Configuration changes:, Alerts and notifications:, and Dashboard statistics and reports: have similar features and look and feel.
Figure 207: AAA > Accounting — An example of an internal search interface
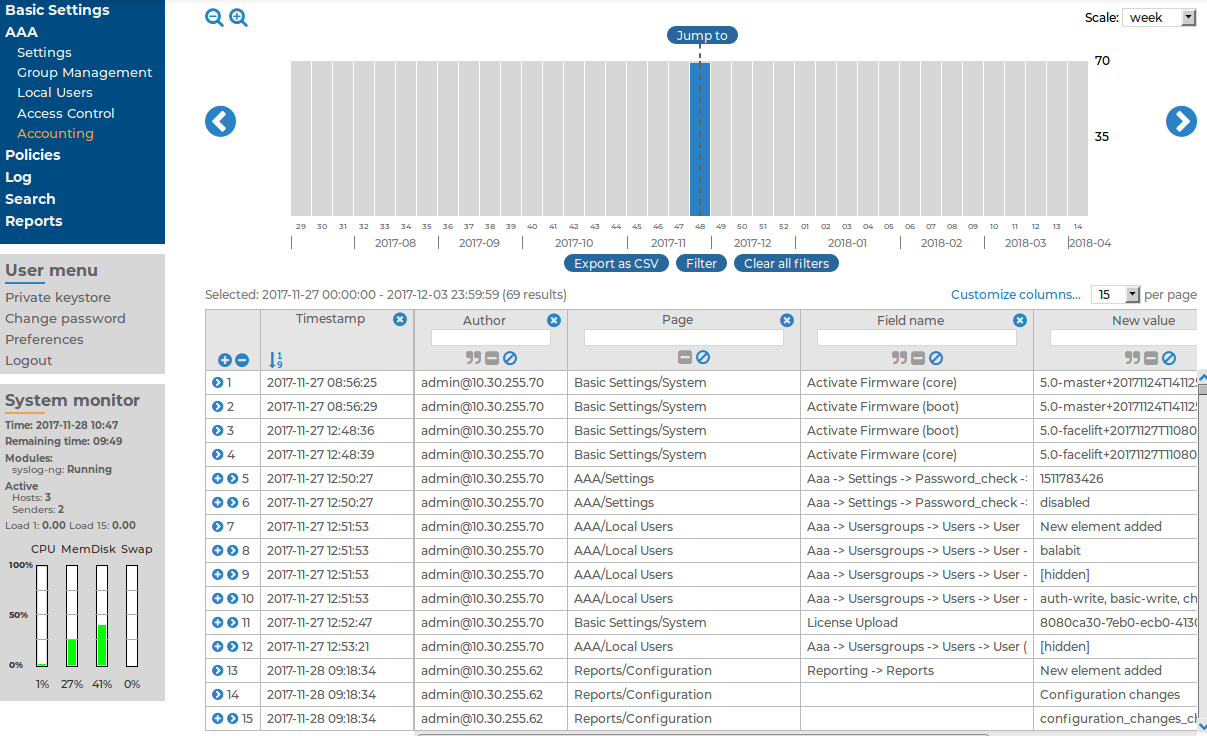
The bars display the number of log messages in the selected interval. Use the  and
and  icons to zoom, and the arrows to display the previous or the next intervals. To explicitly select a date, select Jump to and set the date in the calendar. You can change the length of the displayed interval with the Scale option.
Hovering the mouse above a bar displays the number of entries and the start and end date of the period that the bar represents. Click a bar to display the entries of that period in the table. Use Shift+Click to select multiple bars.
If data is too long to fit on one line, it is automatically wrapped and only the first line is displayed. To expand a row, click  . To shrink the row back to its original size, click
  . To expand/shrink all rows, click the respective button on the header of the table. The rows can also be expanded/shrunk by double-clicking on the respective row.
