Chat now with support
Chat with Support

One Identity Safeguard for Privileged Sessions 6.0.12 - Administration Guide

Preface Introduction The concepts of One Identity Safeguard for Privileged Sessions (SPS) Cloud deployment considerations The Welcome Wizard and the first login Basic settings
Supported web browsers and operating systems The structure of the web interface Network settings Configuring date and time System logging, SNMP and e-mail alerts Configuring system monitoring on SPS Data and configuration backups Archiving and cleanup Forwarding data to third-party systems Joining to One Identity Starling
User management and access control Managing One Identity Safeguard for Privileged Sessions (SPS)
Controlling One Identity Safeguard for Privileged Sessions (SPS): reboot, shutdown Managing Safeguard for Privileged Sessions (SPS) clusters Managing a high availability One Identity Safeguard for Privileged Sessions (SPS) cluster Upgrading One Identity Safeguard for Privileged Sessions (SPS) Managing the One Identity Safeguard for Privileged Sessions (SPS) license Accessing the One Identity Safeguard for Privileged Sessions (SPS) console Sealed mode Out-of-band management of One Identity Safeguard for Privileged Sessions (SPS) Managing the certificates used on One Identity Safeguard for Privileged Sessions (SPS)
General connection settings HTTP-specific settings ICA-specific settings RDP-specific settings SSH-specific settings Telnet-specific settings VMware Horizon View connections VNC-specific settings Indexing audit trails Using the Search interface Searching session data on a central node in a cluster Advanced authentication and authorization techniques Reports The One Identity Safeguard for Privileged Sessions (SPS) RPC API The One Identity Safeguard for Privileged Sessions (SPS) REST API One Identity Safeguard for Privileged Sessions (SPS) scenarios Troubleshooting One Identity Safeguard for Privileged Sessions (SPS) Using SPS with SPP Configuring external devices Using SCP with agent-forwarding Security checklist for configuring One Identity Safeguard for Privileged Sessions (SPS) Jumplists for in-product help LDAP user and group resolution in SPS Appendix: Deprecated features Glossary

Connection statistics

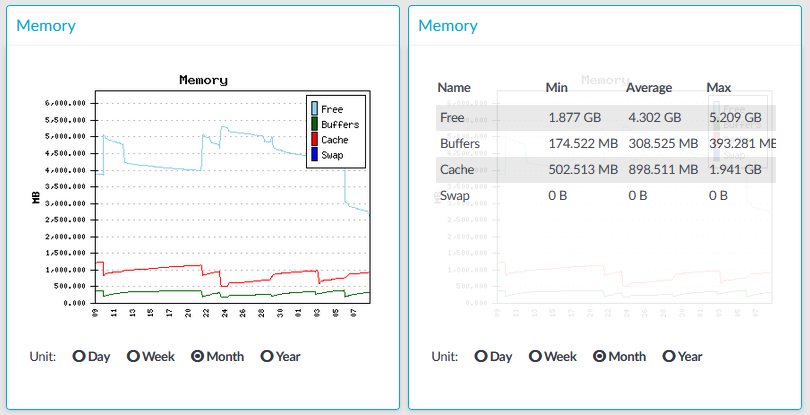
Figure 290: Basic Settings > Dashboard > Connection statistics

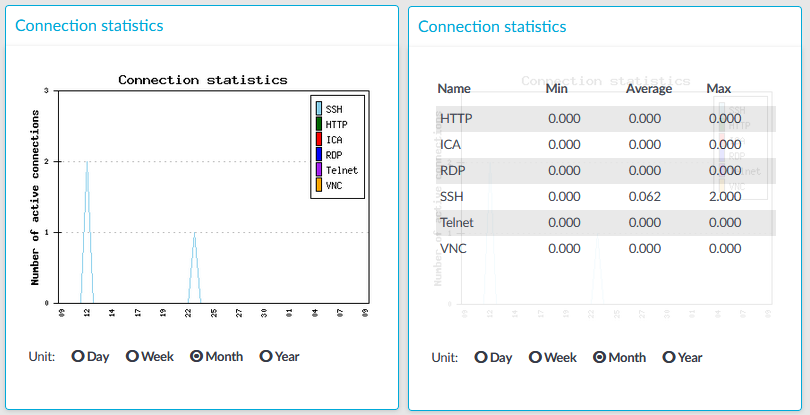
The Connection statistics module on the Dashboard is based on statistics of high-level proxy-service protocols (SSH, RDP, VNC, ICA, and so on). These numbers display all active high-level proxy-service protocols, but these numbers are counted by all service connections too, which are connected to some protocols. Because of this, these numbers can differ from the numbers displayed on the Active Connections page.

For example, if there are several active ICA connections in your system, it means that there are approximately the same number of CGP connections that are opened and counted in the Connection statistics module under the ICA label. If these CGP or ICA high-level proxy-service protocols are opening more than one TCP connections, these connections will be counted in the Network connetion module as different TCP connections, but these will count as only one connection on the Active Connections page.
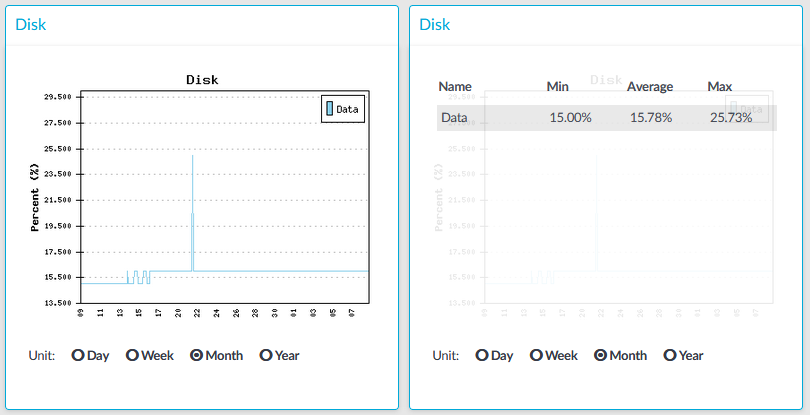
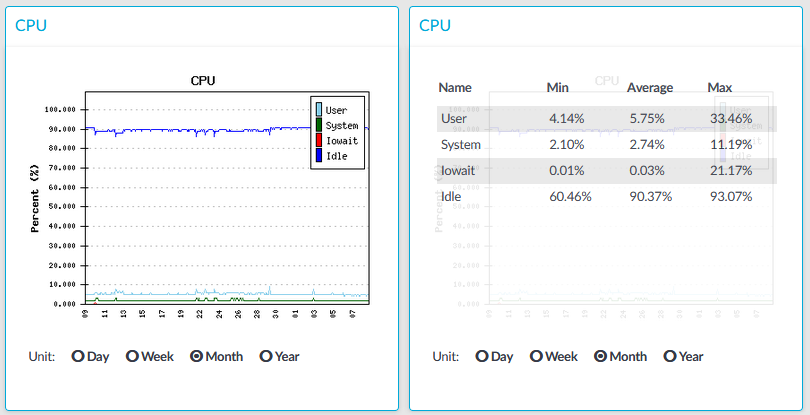
Statistics

The connection types displayed can be the following:

  • RDP: The number of RDP connections.

  • SSH:The number of SSH connections.

  • HTTP: The number of HTTP connections.

  • ICA: The number of Citrix connections.

  • Telnet: The number of Telnet connections.

  • VNC: The number of VNC connections.

The Min, Average and Max values are displayed as a whole number if the value is constant for the statistics interval (the statistics are stored every 5 minutes). If minor changes occur in the actual values (for example, new connections are established), these changes can be displayed as fractions.

Memory

Figure 291: Basic Settings > Dashboard > Memory

The Memory module on the Dashboard is based on data provided by the Linux kernel (/proc and /sys directories). The standard Munin plugins query this information from these locations and they are displayed on the GUI.

Statistics

The memory types displayed are the following:

  • Free: Free memory

  • Buffers: In-memory block I/O buffers.

  • Cache: Memory used for disk caching. This does not count as "used" memory, because it is freed when it is required.

  • Swap: Swap space usage (memory contents that have been temporarily moved to disk).This value might be high in case of lack of memory.

Disk

Figure 292: Basic Settings > Dashboard > Disk

The Disk module on the Dashboard is based on the output of the df command.

Statistics

The information displayed is the following:

  • Data: The percent of disk that the core firmware uses.

CPU

Figure 293: Basic Settings > Dashboard > CPU

The CPU module on the Dashboard is based on data provided by the Linux kernel (/proc and /sys directories). The standard Munin plugins query this information from these locations and they are displayed on the GUI.

Statistics

The following details are displayed about CPU usage:

  • Idle: Idle time of the processors. If there are more than one processors, they all add up to x100%, for example in case of 2 processors it adds up to 200% maximum.

  • Iowait: Time spent receiving and handling hardware interrupts as a percentage of processor ticks. That is, waiting for IO.

  • System: Kernel CPU usage.

  • User: CPU usage of everything other than kernel.

Related Documents

The document was helpful.

Select Rating

I easily found the information I needed.

Select Rating