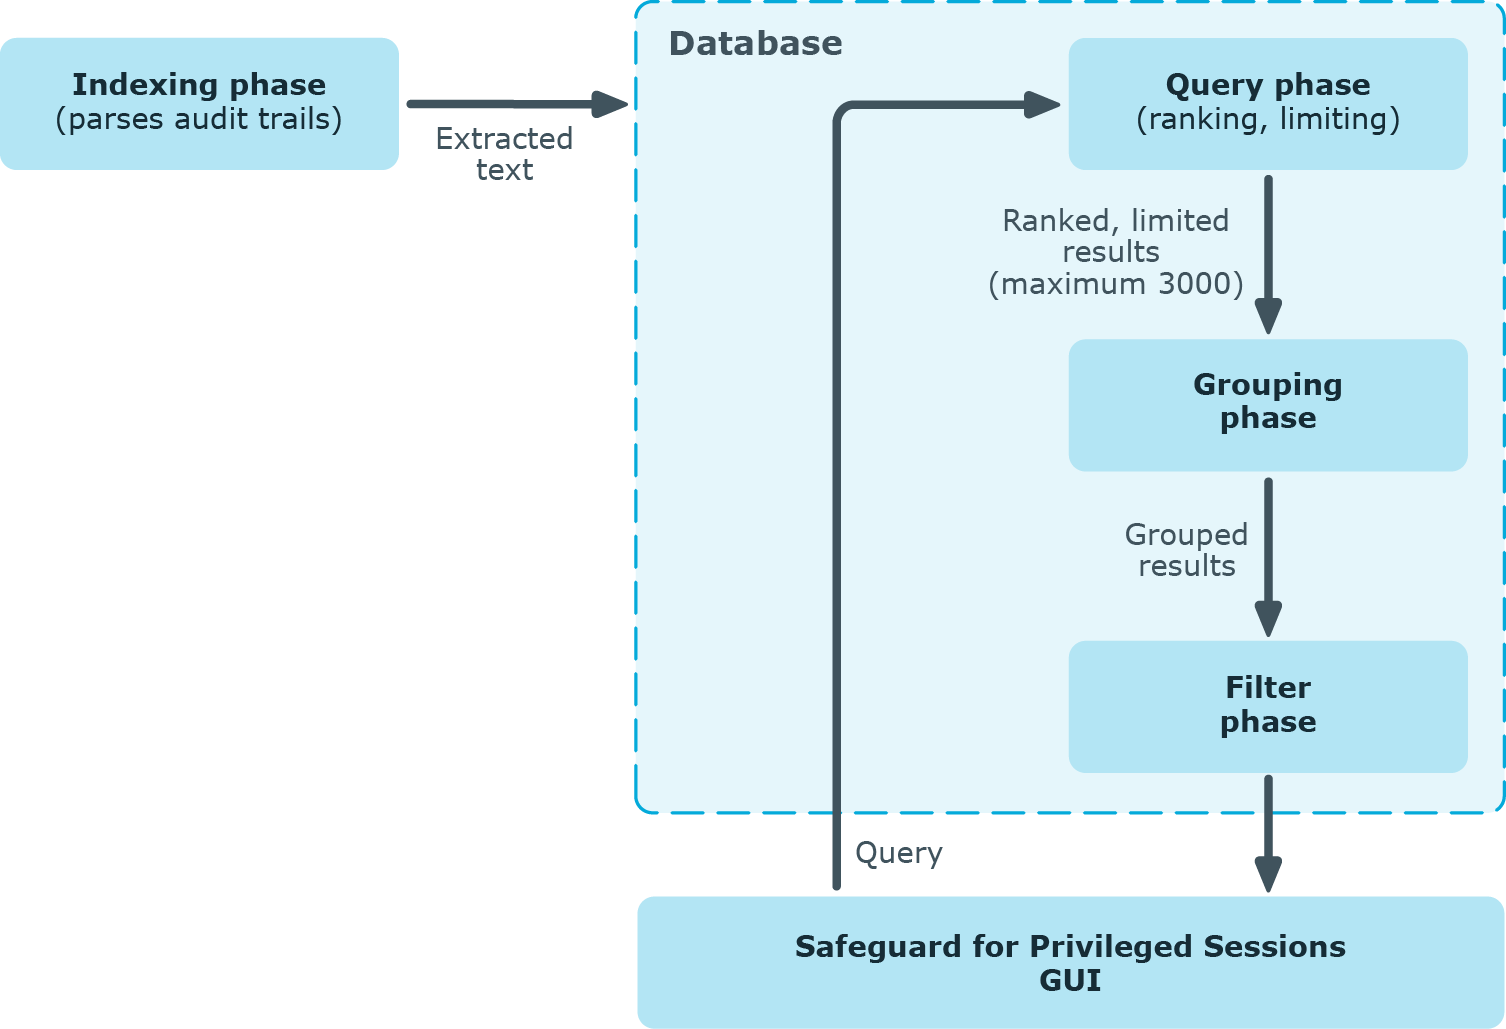
The screen content is first indexed, then processed with the search backend, and finally, the filter expressions are applied. This process is described in detail in the following sections.
Figure 231: The search and filter process
Prerequisites - Indexing phase
First, as a prerequisite of the search process, screen content is indexed. The indexing phase generates a database that the search and filter processes will run on.
The indexer parses the audit trail files, and builds an "inventory" of the privileged user's activity data based on what appeared on their screen.
-
In the case of a terminal session, screen content corresponds to the activity data that is captured in a terminal window. In the case of graphical protocols, screen content is whatever is visible in the graphical user interface of the applications the user is interacting with. In the latter case, the indexer's Optical Character Recognition (OCR) engine extracts text that appeared on the screen (for example, window titles).
NOTE: If a piece of text is displayed for less than 1 second, it is not extracted.
-
The indexer returns the information extracted from the parsed audit trail files to One Identity Safeguard for Privileged Sessions (SPS). In the case of a terminal session, the captured text is put in the backend database as one document per one second of screen content. Because of this, the content that you have searched for might only partially appear in the screenshot. In the case of graphical protocols, the captured text is put in the backend database as one document per screenshot.
-
The queries will be run on this database during the search process.

For details on indexing, see Indexing audit trails.
Search and filter process phases
The search and filter process consists of three major phases:
-
Query phase
-
Grouping phase
-
Filter phase
Query phase
In the query phase, the backend ranks and then limits the number of results.
-
The result of one query is the top 3000 documents, ordered by the default ranking system of the backend.
This means that if there are more than 3000 results, those of the lowest rank will not be passed to the next phase at all.
The ranking system cannot be modified, so there is no way to "upvote" those results of lower ranks.
If you want to ensure that all important results are passed to the grouping phase, use a smaller time range that you run the query on. If there are fewer than 3000 results, it is certain that the events you are interested in will be included in the grouping phase.
-
The grouping phase receives the results.
Grouping phase
The grouping phase groups the results that were passed on from the query phase.
-
First, the results with the same trail IDs are grouped together. A trail ID group contains all search hits that are in that trail.
-
The trail ID groups are then further grouped by seach expression and time range. This group is essentially the time range during which the expression is displayed on the screen (for example, if the text root is displayed from 00:00:12 to 00:01:45, this will be one group).
-
This grouped result is displayed in the search screen as one row.
Filter phase
The filter phase applies filter expressions to these grouped results.
|
|
NOTE:
If there were screen content search results that were excluded during the query phase, the filter expressions will not be applied to them. |
Example: Filtering for search results that were excluded in the query phase
For example, if you want to filter for Telnet connections where the text root was displayed, the following can happen:
You search for the Screen content: root. There are 3100 search results that consist of 3050 SSH connections and 50 Telnet connections. In this example, Telnet connections received the lowest ranks for some reason. 100 results that have received the lowest rank are excluded, and in this example it means all Telnet connections.
If you filter for protocol Telnet now, you will not see any results.
To remedy this situation, try searching in a smaller time range to make sure that there are less than 3000 search results. If you are unsure about the time range, you might want to attempt fine-tuning the backend search manually. For details, see: Fine-tuning the backend search manually.
Fine-tuning the backend search manually
You can fine-tune your search manually with the command line utility lucenectl. To do this, log on to the core shell. For details, see Accessing the One Identity Safeguard for Privileged Sessions (SPS) console.
-
Specify more exact time ranges (use Unix timestamps).
For example, to limit the time range to Thursday, June 30, 2016 11:39:51 AM - Thursday, November 3, 2016 2:44:46 PM, enter the following command:
lucenectl search --from-to 1467286791 1478184286 --text remote --limit 3000 --aggregate-by-trail --normalize-rank
NOTE: For converting timestamps to Unix timestamp, use https://www.epochconverter.com/.
-
Increase the query limit of 3000 to a limit of your choice.
For example, to increase the query limit of 3000 to 4500, enter the following command:
lucenectl search --from-to 1467286791 1478184286 --text <your-screen-content-search-expression> --limit 4500 --aggregate-by-trail --normalize-rank
lucenectl search --from-to 1467286791 1478184286 --text remote --limit 4500 --aggregate-by-trail --normalize-rank
NOTE: If you do not receive more results with a larger query limit, it means that you have found all results with your search expression.
However, the downside of using lucenectl to fine-tune your search is that after the cli search, you have to manually extract the trails that you find interesting with the help of the metadb.
The following example shows the output of a lucenectl search:
{
 "hits": [
   {
     "hits_count": 1,
     "channel_id": 1,
     "trail_id": "58",
     "rank": 0.4068610216585047
   },
   {
     "hits_count": 7,
     "channel_id": 761,
     "trail_id": "12",
     "rank": 1.0
   },
   {
     "hits_count": 2,
     "channel_id": 1,
     "trail_id": "139",
     "rank": 0.5923645275802537
   }
 ]
}
-
rank: the larger the number, the higher the rank
-
hits_count: the number of times the screen content search expression is displayed in the audit trail
-
trail_id: the ID of the trail
-
channel_id: the ID of the channel
The most relevant audit trail will probably be the one with the highest rank.
If you have determined which audit trail you are interested in, enter the following command. The value of _connection_channel_id will be the value of the trail_id from the lucenectl output that you have determined as most relevant.
psql -U scb scb -c "select audit from channels where _connection_channel_id = 12;"
The output of this command will be:
/<audittrailpath>/audit-scb_rdp-1467274538-0.zat:2
/<audittrailpath>/audit-scb_rdp-1467274538-0.zat:1
From this output, the audit trail file name path is as follows: /<audittrailpath>/audit-scb_rdp-1467274538-0.zat
|
|
NOTE:
If you cannot find the file at the path, check whether it has been archived and search for the file in the archive path. Use the following command: psql -U scb scb -c "select audit, _archive_path from channels where _connection_channel_id = 12;" The output of this command will be: audit | _archive_path
---------------------------------------------------------+---------------
/<audittrailpath>/audit-scb_rdp-1467274538-0.zat:2 | /<myarchive/path>/
/<audittrailpath>/audit-scb_rdp-1467274538-0.zat:1 | /<myarchive/path>/
|
If you still cannot find the audit trail, contact our Support Team. |
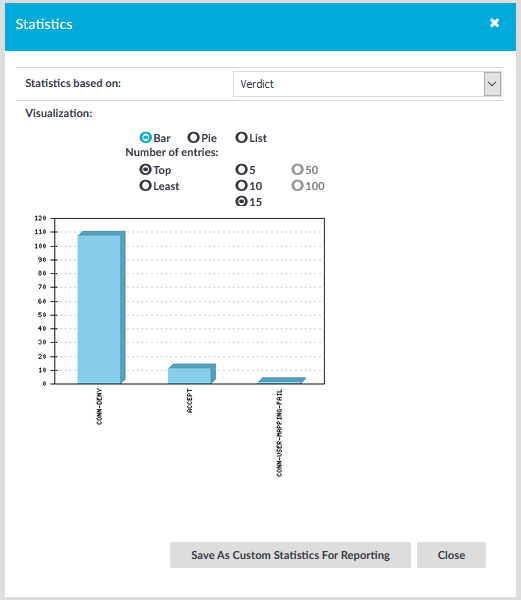
 icon in the header of the table. A pop-up window is displayed.