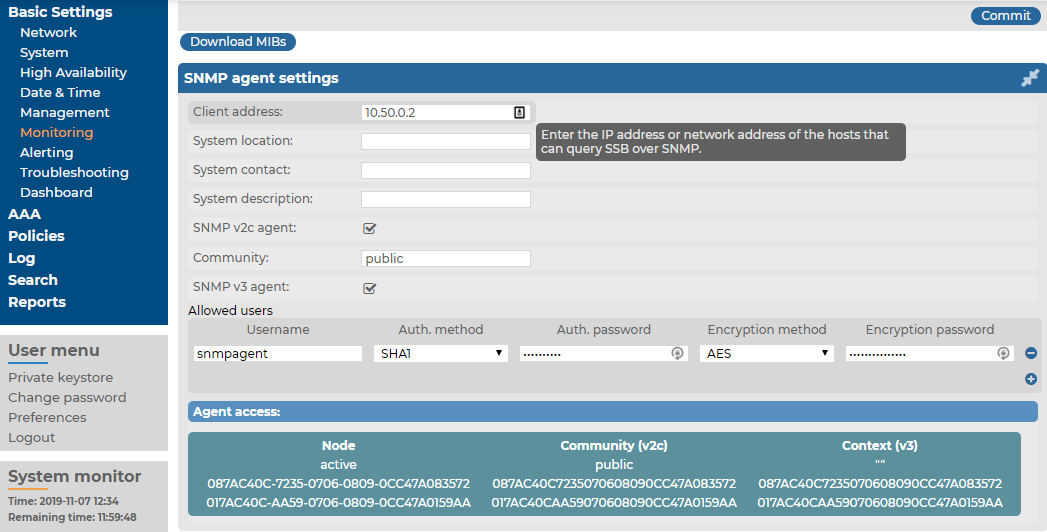
Configuring SNMP agent settings
syslog-ng Store Box (SSB) continuously monitors a number of parameters of the SSB hardware and its environment. If a parameter reaches a critical level (set in its respective Maximum field), SSB sends e-mail and SNMP messages to alert the administrator.
SSB sends SNMP alerts using the external network interface by default, or using the management interface if it is enabled. SSB supports the SNMPv2c and SNMPv3 protocols. The SNMP server set on the Alerting tab can query status information from SSB.
TIP: To have your central monitoring system recognize the SNMP alerts sent by SSB, select Basic Settings > Monitoring > Download MIBs to download the SSB-specific Management Information Base (MIB), then import it into your monitoring system.
Figure 50: Basic Settings > Monitoring > SNMP agent settings
The following sections describe the parameters you can receive alerts on.
For details on monitoring SSB with an external central monitoring system, see Monitoring SSB.
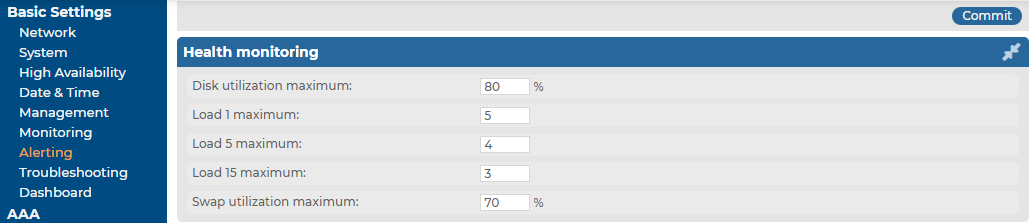
Health monitoring
This section provides information about health monitoring, SNMP trap settings, and health related traps.
To configure health monitoring on syslog-ng Store Box (SSB), navigate to Basic Settings > Alerting.
Figure 51: Basic Settings > Alerting — Health monitoring
-
Disk utilization maximum: Ratio of free space available on the hard disk. SSB sends an alert if the log files use more space than the set value. Archive the log files to a backup server to free disk space. For details, see Archiving and cleanup.
NOTE: The alert message includes the actual disk usage, not the limit set on the web interface. For example, you set SSB to alert if the disk usage increases above 10 percent. If the disk usage of SSB increases above this limit (for example to 17 percent), you receive the following alert message: less than 90% free (= 17%). This means that the amount of used disk space increased above 10% (what you set as a limit, so it is less than 90%), namely to 17%.
-
Load 1|5|15 maximum: The average load of SSB during the last one, five, or 15 minutes.
-
Swap utilization maximum: Ratio of the swap space used by SSB. SSB sends an alert if it uses more swap space than the set value.
Health related traps and SNMP trap settings
For health related alerts, SSB sends SNMP alerts using the management network interface by default, or using the external interface if the management interface is disabled. SSB supports the SNMPv2c and SNMPv3 protocols. The SNMP server set on the Alerting tab can query status information from SSB.
To configure SNMP trap settings
-
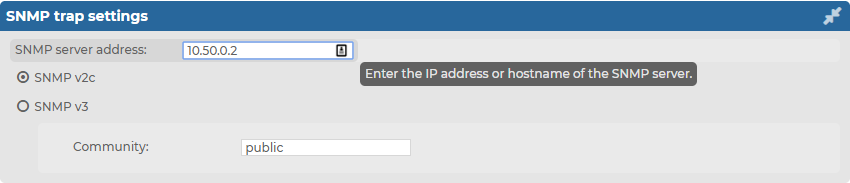
Navigate to Basic Settings > Alerting > SNMP trap settings.
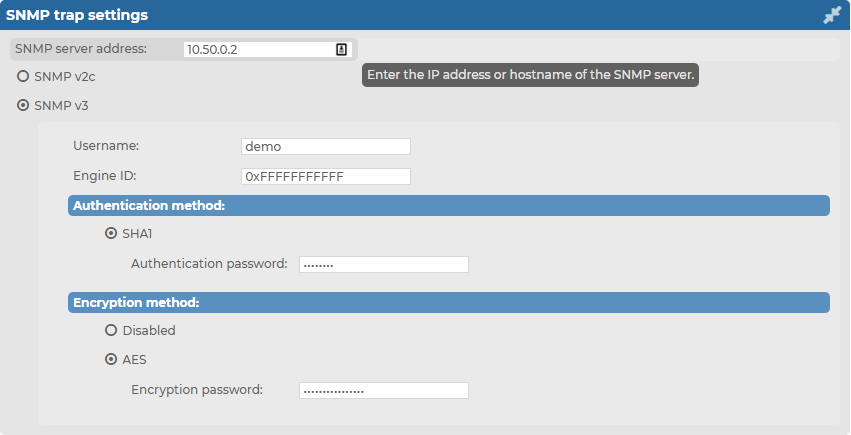
Figure 52: Basic Settings > Alerting > SNMP trap settings.
-
If you want to configure SNMP v2c trap settings, select SNMP v2c, provide the SNMP server address you want to use, and enter the name of the SNMP community you want to use in the Community: field.
If you want to configure SNMP v3 trap settings, select SNMP v3, provide the SNMP server address, the Username and the Engine ID you want to use, then configure the Authentication method and Encryption methodyou want to use.
-
Click  .
.
To enable notifications about health related issues
-
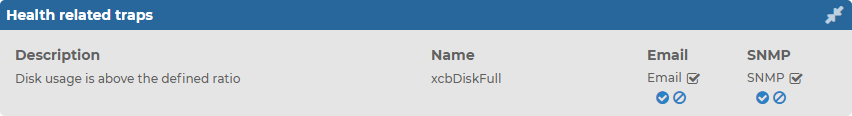
Navigate to Basic Settings > Alerting > Health related traps and enable alert Disk usage is above the defined ratio.
Figure 53: Basic Settings > Alerting > Health related traps — Enable alert
-
Click .
Preventing disk space fill up
The following section describes how to prevent disk space from filling up.
To prevent disk space from filling up
-
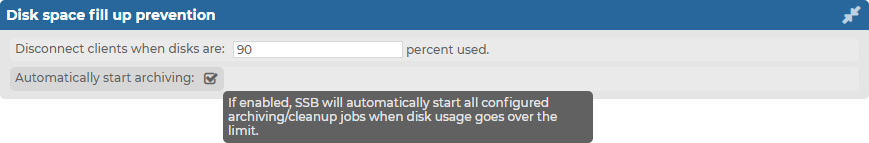
Navigate to Basic Settings > Management > Disk space fill up prevention.
Figure 54: Basic Settings > Management > Disk space fill up prevention
-
Set the limit of maximum disk utilization in percents in the respective field. When disk space is used above the set limit, syslog-ng Store Box (SSB) disconnects all clients. The default value is 90, and you can set values between 1-99.
-
Optional step: Enable the Automatically start archiving option to automatically start all configured archiving/cleanup jobs when disk usage goes over the limit.
NOTE: If there is no archiving policy set, enabling this option will not trigger automatic archiving.
-
Click .
-
Navigate to Basic Settings > Alerting > Health related traps and enable alert Disk usage is above the defined ratio.
Figure 55: Basic Settings > Alerting > Health related traps — Enable alert
-
Click .
Configuring message rate alerting
With message rate alerting, you can detect the following abnormalities in syslog-ng Store Box(SSB):
-
The syslog-ng inside SSB has stopped working.
-
One of the clients/sites sending logs is not detectable.
-
One of the clients/sites is sending too many logs, probably unnecessarily.
Message rate alerting can be set for sources, spaces and destinations (remote or local).
To configure message rate alerting
-
Navigate to Log and select Sources, Spaces or Destinations.
-
Enable Message rate alerting.
-
In case of Sources, select the counter to be measured:
-
Messages: Number of messages
-
Messages/sender: Number of messages per sender (the last hop)
-
Messages/hostname: Number of messages per host (based on the hostname in the message)
In case of Spaces or Destinations, the counter is the number of messages.
-
Select the time period (between 5 minutes and 24 hours) during which the range is to be measured.
-
Enter the range that is considered normal in the Minimum and Maximum fields.
-
Select the alerting frequency in the Alert field. Once sends only one alert (and after the problem is fixed, a "Fixed" message), Always sends an alert each time the result of the measurement falls outside the preset range.
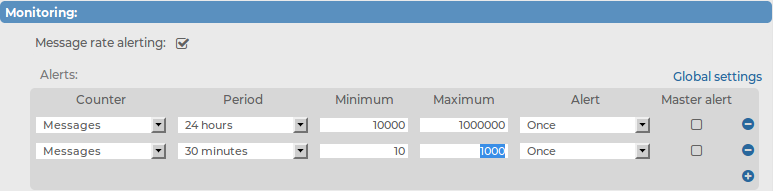
Example: Creating an early time alert
In case you want an early time alert, can create a normal (non master) alert with a very low minimum number of messages and a low check interval.
Figure 56: Log > Sources > Message rate alerting — Create an early time alert
-
If you have set more than one message rate alerts, you can set a master alert where applicable. To set an alert to be a master alert, select the Master alert checkbox next to it.
When a master alert is triggered (and while it remains triggered), all other alerts for the given source/destination/space are suppressed. A master alert only blocks the other alerts that would be triggered at the given timeslot. A 24-hour alert does not block alerts that would be triggered at, for example 00:05.
Suggestions for setting the master alert:
-
set the master alert to low check interval (5 minutes, if possible)
-
set the master alert to a lower check interval than the alerts it suppresses
-
set the master alert to have more lax limits than the alerts it suppresses
The following examples demonstrate a few common use cases of a Master alert.
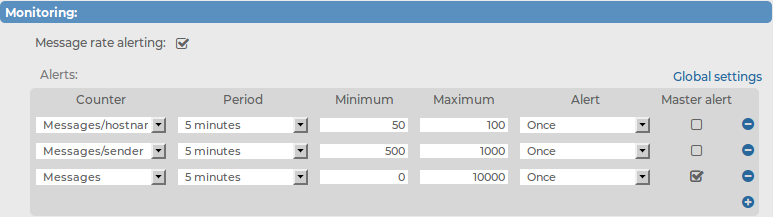
Example: Using the master alert to indicate unexpected events
The user has 2 relays (sender) and 10 hosts per each relay (=20 hosts). Each host sends approximately 5-10 messages in 5 minutes. Two message rate alerts are set, and one master alert to signal extreme unexpected events. Such event can be that either a host is undetectable and probably has stopped working, or that it sends too many logs, probably due to an error. The following configuration helps detecting these errors without having to receive hundreds of alerts unnecessarily.
Figure 57: Log > Sources > Message rate alerting — Use a master alert to indicate unexpected events
-
Optional step: Global alerts count the number of all messages received by syslog-ng on all sources, including internal messages.
-
Navigate to Log > Options > Message rate alerting statistics. To add a global alert, click  at Global alerts.
-
Select the time period (between 5 minutes and 24 hours) during which the range is to be measured.
-
Enter the range that is considered normal in the Minimum and Maximum fields.
-
Select the alerting frequency in the Alert field. Once sends only one alert (and after the problem is fixed, a "Fixed" message), Always sends an alert each time the result of the measurement falls outside the preset range.
-
To set the alert as a system-wide master alert, select Global master alert. It will suppress all other log rate alerts on SSB when it is triggered.
NOTE: In the following cases, a so-called "always"-type super-master alert is triggered automatically.
If all or some of the statistics from syslog-ng cannot be fetched, an alert is sent out and all other errors are suppressed until the error is fixed.
If, for some reason, syslog-ng sends an unprocessable amount of statistics (for example because of some invalid input data), a similar super-master alert is triggered and stops processing the input.
-
Optional step: Navigate to Log > Options > Message rate alerting statistics. Set the maximum number of alerts you want to receive in Limit of alerts sent out in a batch to prevent alert flooding. SSB will send alerts up to the predefined value and then one single alert stating that too many message alerts were generated and the excess amount have not been sent.
|

|
Caution:
Hazard of data loss The alerts over the predefined limit will be unreachable. |
