To control the quantity and quality of the statistics collected to the Dashboard, set the statistics collection options.
Navigate to Log > Options > Dashboard statistics.
Time-based statistics: The default setting is Enabled.
-
Cleanup if unchanged for: Statistics unchanged (not present in syslog-ng statistics output anymore) for this number of days will be cleaned up from the system. Enter 0 here to keep them forever. To start the cleanup process immediately, click Cleanup now.
-
Enable statistics for: The default setting is that all checkboxes are enabled. This allows you to select which options to collect statistics for. To display the collected statistics for an option, navigate to Basic Settings > Dashboard > Syslog-ng statistics, select Time-based statistics and select the desired option.
NOTE: When disabling an option, the data will only be deleted after the first cleanup. Until then, the data already collected is still accessible on the dashboard.
Top/Least statistics: the default setting is Enabled and all checkboxes are enabled. This allows you to select which options to collect statistics for. To display the collected statistics for an option, navigate to Basic Settings > Dashboard > Syslog-ng statistics, select Top/Least statistics and select the desired option.
Maximum number of statistics to process: Enter the number of statistics files to keep on the system. Enter 0 here to store unlimited number of statistics files. Statistics over this limit will be dropped, and SSB sends an error message containing the number of entries dropped and the first dropped entry. This setting needs to be increased only if you have more than 10000 hosts.
Sampling interval: Select the sampling interval for the statistics here. A more frequent sampling interval results in more precise graphs at the cost of heavier system load. The default setting is 5 minutes. The possible parameters are 5 minutes, 10 minutes, 30 minutes, 60 minutes, 2 hours, 4 hours, 8 hours, 1 day.
|

|
Caution:
Hazard of data loss When changing the Sampling interval, the already existing statistics are not converted to the new sampling rate, but are deleted. |
To clear all statistics, click Clear all statistics. It is advised to clear statistics if you have changed the number of the statistics files to keep, or if you have disabled the time-based statistics collection.
The syslog-ng Store Box(SSB) appliance periodically creates reports on the activity of the administrators, the system-health information of SSB, as well as the processed traffic. These reports are available in Portable Document (PDF) format by selecting Reports > Generated reports from the Main menu. The reports are also sent to the email address set at Basic Settings > Management > Mail settings > Send reports to, unless specified otherwise in the configuration of the report.
To access the reports from the SSB web interface, the user must have the appropriate privileges.
NOTE: If the Basic Settings > Management > Mail settings > Send reports to address is not set, the report is sent to the SSB administrator's email address.
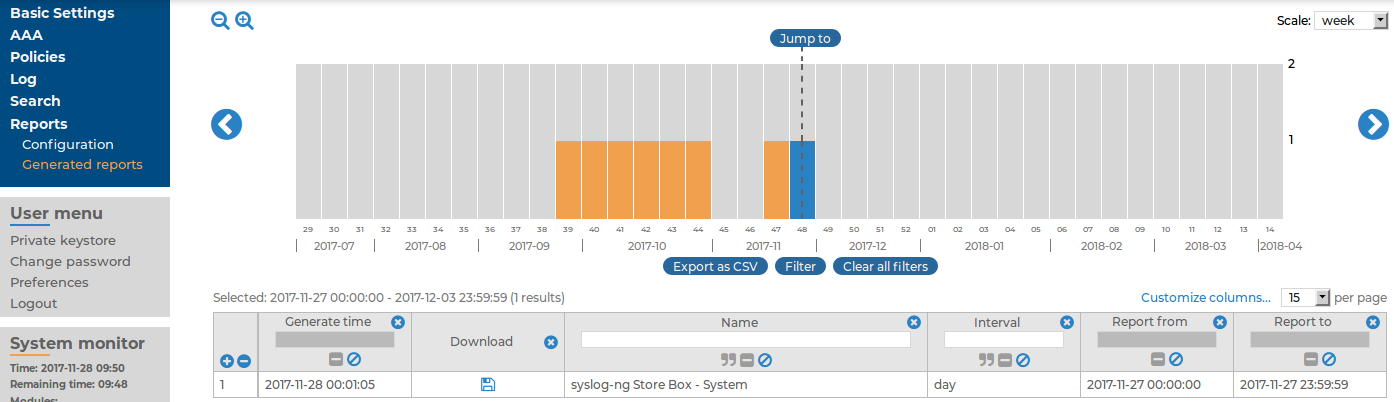
Figure 231: Reports > Generated reports — Browsing reports
Reports are generated as follows:
-
Daily reports are generated every day at 00:01.
-
Weekly reports are generated every week on Monday at 00:01.
-
Monthly reports are generated on the first day of every month at 00:01.
TIP: Use the time bar to find reports that apply a particular period. If you select a period (for example, click on a bar), only those reports will be displayed that contain information about the selected period.
The following information is available about the reports:
-
Download: A link to download the report.
-
Name: The name of the report.
-
Interval: The length of the reported period, for example, week, month, and so on.
-
Report from: The start of the reported interval.
-
Report to: The end of the reported interval.
-
Generate time: The date when the report was created.
TIP: To create a report for the current day, select Generate reports for today. The report will contain data for the 00:00 - current time interval. If artificial ignorance (for details, see Classifying messages with pattern databases) is enabled, an artificial ignorance report is created as well.
For details on how to navigate around the user interface and interact with features such as filtering and exporting results, and customizing what data is displayed, see Using the internal search interfaces.
The default report of the syslog-ng Store Box(SSB) appliance (called System) is available in Adobe Portable Document Format (PDF), and contains the following information for the given period:
-
Configuration changes: Lists the number of SSB configuration changes per page and per user. The frequency of the configuration changes is also displayed on a chart.
-
Peer configuration: Lists the number of times the configuration of a syslog-ng client was changed per client, as well as the version number of the syslog-ng application running on the client (if this information is available).
-
Alerts: Various statistics about the alerts received from classifying messages using the pattern database (if pattern databases have been uploaded to SSB).
-
syslog-ng traffic statistics: Displays the rate of incoming, forwarded, stored, and dropped messages in messages/second.
-
System health information: Displays information about the filesystem and network use of SSB, as well as the average load.
The following describes how to generate a report manually for a period that has not been already covered in an automatic report.
To generate a report manually for a period that has not been already covered in an automatic report
-
Log in to the syslog-ng Store Box(SSB) web interface, and navigate to Reports > Configuration.
-
Select the report you want to generate.
-
-
To create a report from the last daily report till now, click Generate partial daily report. For example, if you click this button at 11:30 AM, the report will include the period from 00:01 to 11:30.
-
To create a report from the last weekly report till now, click Generate partial weekly report. For example, if you click this button on Wednesday at 11:30 AM, the report will include the period from Monday 00:01 to Wednesday 11:30.
-
To create a report from the last monthly report till now, click Generate partial monthly report. For example, if you click this button at 11:30 AM, December 13, the report will include the period from December 1, 00:01 to December 13, 11:30.
The report will be automatically added in the list of reports (Reports > Generated reports), and also sent in an email to the regular recipients of the report.
-
Click  .
.
