Log message alerts
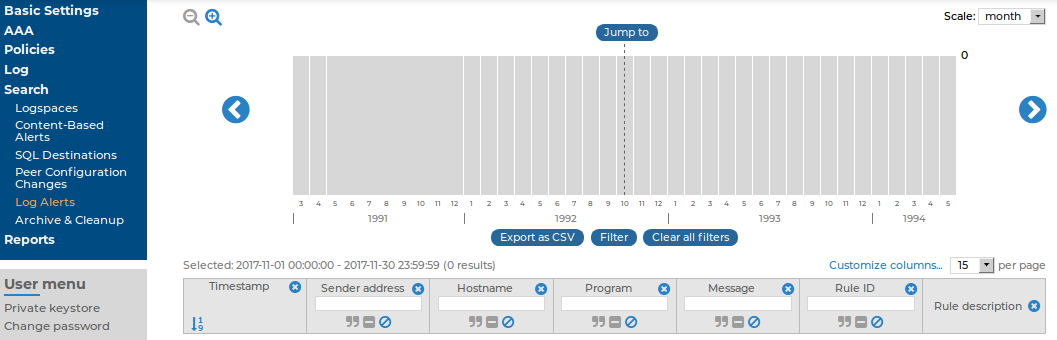
When using the pattern database, syslog-ng Store Box(SSB) raises alerts for messages that are classified as Violation. The history of these alerts is available at Search > Alerts. The following information is available about the alerts:
Figure 228: Search > Log Alerts — Displaying alert messages
-
Timestamp: The date of the alert in YEAR-MONTH-DAY HOUR:MINUTE:SECOND format.
-
Sender address: The IP address of the client or relay that sent the message directly to SSB.
-
Hostname: The hostname or IP address of the client that sent the message.
-
Program: The application that generated the message.
-
Message: The content of the message.
-
Rule ID: The ID of the classification rule in the pattern database that matched the message. For details, see Classifying messages with pattern databases.
-
Rule description: The description of the classification rule that matched the message. For details, see Classifying messages with pattern databases.
For details on how to navigate around the user interface and interact with features such as filtering and exporting results, and customizing what data is displayed, see Using the internal search interfaces.
Notifications on archiving and backups
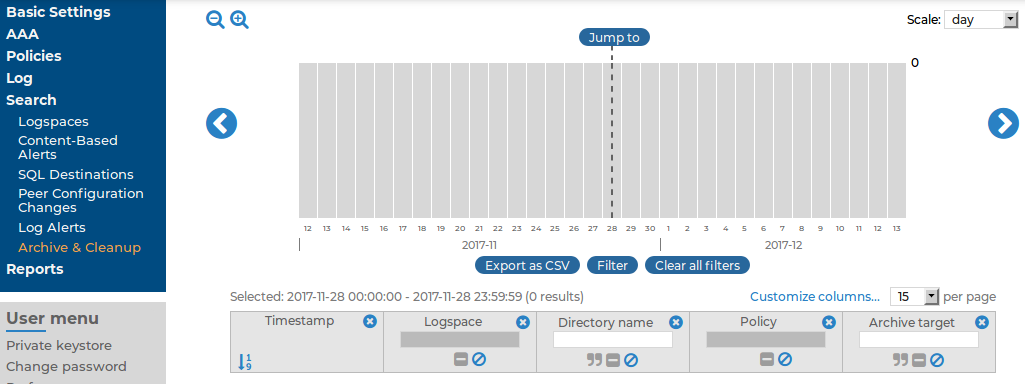
Notifications and error messages of the archiving, cleanup and backup procedures are available at Search > Archive & Cleanup. The following information is available:
Figure 229: Search > Archive & Cleanup — Displaying archiving and backup notifications
-
Timestamp: The date of the message in YEAR-MONTH-DAY HOUR:MINUTE:SECOND format.
-
Logspace: The name of the archived or backed up logspace.
-
Directory name: The name of the folder where the archives and backups are located. A new folder is created each day, using the current date as the folder name.
-
Policy: The name of the archive or backup policy used.
-
Archive target: The address of the remote server used in the policy.
-
Manual archiving: Indicates if the archiving or backup process was started manually.
For details on how to navigate around the user interface and interact with features such as filtering and exporting results, and customizing what data is displayed, see Using the internal search interfaces.
Status history and statistics
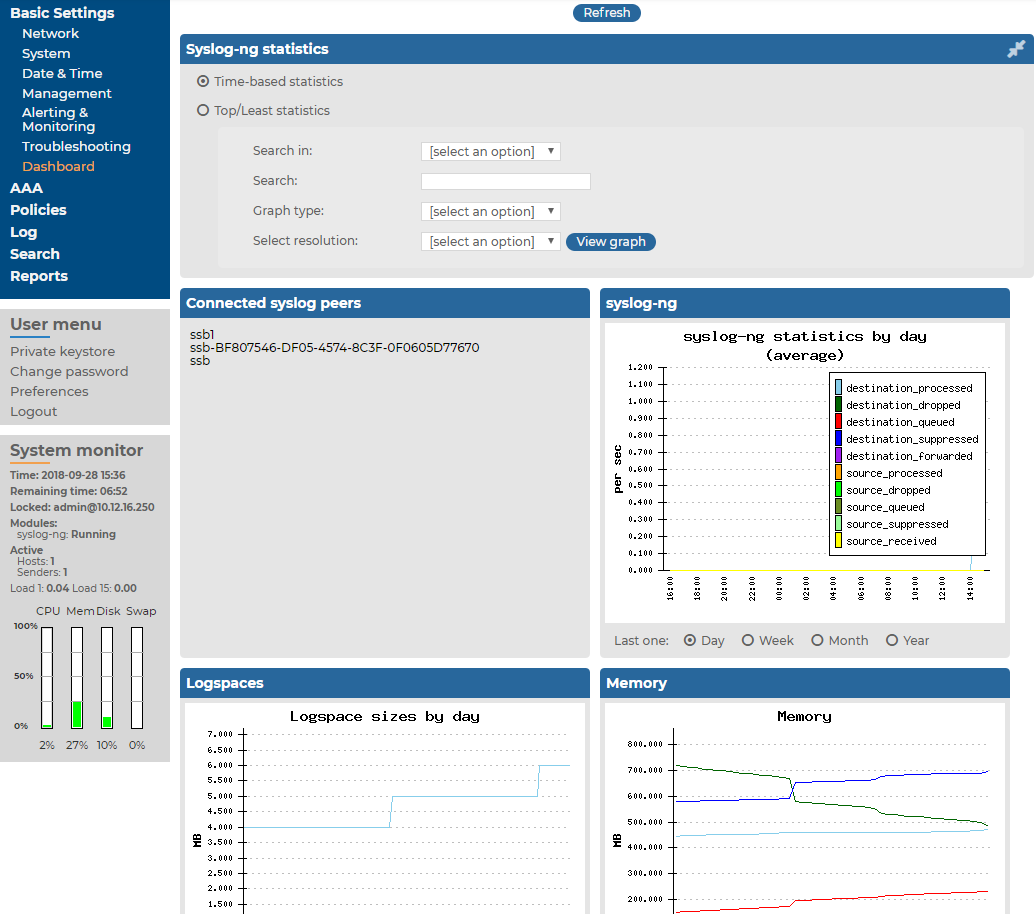
The syslog-ng Store Box(SSB) appliance displays various statistics and the status history of system data and performance on the dashboard at Basic Settings > Dashboard. The dashboard is essentially an extension of the system monitor: the system monitor displays only the current values, while the dashboard creates graphs and statistics of the system parameters.
The dashboard consists of different modules. Every module displays the history of a system parameter for the current day. To display the graph for a longer period (last week, last month, or last year), select the Week, Month, or Year options, respectively. Hovering the mouse over a module enlarges the graph and displays the color code used on the graph.
To display the statistics of a module as a table for the selected period, click on the graph.
Figure 230: Basic Settings > Dashboard — The dashboard
The following modules are displayed on the dashboard of SSB:
|

|
Caution:
Statistics about syslog-ng and logspace sizes are not backed up. As a result, following a data restore, the Basic Settings > Dashboard page will not show any syslog-ng and logspace statistics about the period before the backup. |
-
syslog-ng: syslog-ng statistics about the received, processed, and dropped messages. See also Displaying custom syslog-ng statistics.
-
Connected syslog peers: A list of hosts that actively send messages to SSB. Note that these values are updated periodically based on the Sampling interval set on page Log > Options > Dashboard Statistics. For details, see Displaying custom syslog-ng statistics.
-
syslog-ng statistics: The rate of incoming messages in messages/second. Note that the values displayed are average values calculated for the last 15 minutes.
-
Logspaces: The size of the logspaces. Note that these values are updated only every ten minutes.
-
Memory: The memory used by the system.
-
Disk: Filesystem usage for the different partitions.
-
CPU: CPU usage.
-
Network connections: The number of network connections.
-
External interface: Traffic on the external interface.
-
Management interface: Traffic on the management interface.
-
Load average: Average load of the system.
-
Processes: The number of running processes.
For details about setting the statistics collection options, see Statistics collection options.
Displaying custom syslog-ng statistics
The following describes how to display statistics of a specific source, destination, or host.
To display statistics of a specific source, destination, or host
-
Navigate to Basic Settings > Dashboard > syslog-ng statistics.
-
-
To display the statistics of a particular source, select source from the Search in field, and enter the name of the source into the Search field. Source names all start with the s character.
-
To display the statistics of a particular destination, select destination from the Search in field, and enter the name of the destination into the Search field. Destination names all start with the d character.
-
To display the statistics of a particular host, select src.host from the Search in field, and enter the hostname or IP address of the host into the Search field.
-
Select the time period to display from the Select resolution field.
-
Click View graph.
