To track down support requests, the One Identity Support Team might request you to collect system-state and debugging information. This information is collected automatically, and contains log files, the configuration file of syslog-ng Store Box(SSB), and various system-statistics.
NOTE: Sensitive data like key files and passwords are automatically removed from the files.
The Basic Settings > Management > Debug logging > Enable debug logs option is not related to the verbosity of log messages: it adds the commands executed by the SSB web interface to the log.
To collect system-state information, navigate to Basic Settings > Troubleshooting > System debug and click Collect and save current system state info, then save the created zip file. The name of the file uses the debug_info-<hostname>YYYYMMDDHHMM format.
To collect information for a specific error
-
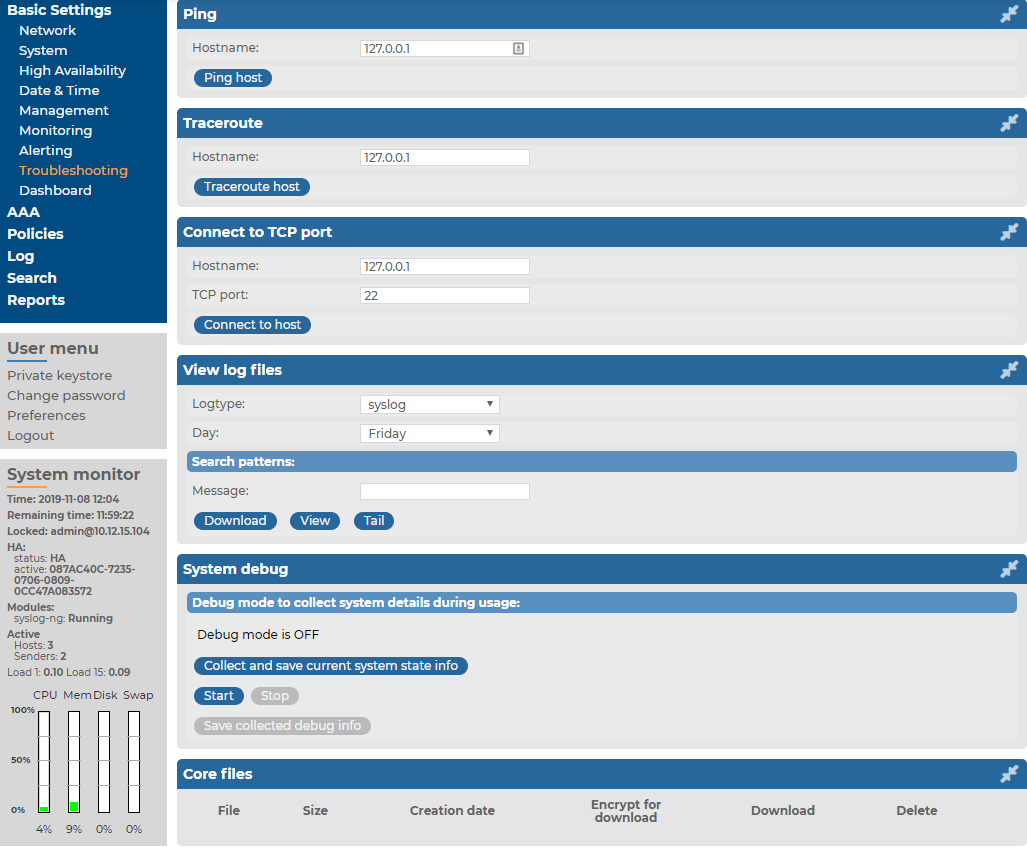
Navigate to Basic Settings > Troubleshooting > System debug.
Figure 241: Basic Settings > Troubleshooting > System debug — Collecting debug information
-
Click Start.
NOTE: Starting debug mode increases the log level of SSB, and might cause performance problems if the system is under a high load.
-
Reproduce the event that causes the error, for example send a log message from a client.
-
Click Stop.
-
Click Save the collected debug info and save the created zip file. The name of the file uses the debug_info-<hostname>YYYYMMDDHHMM format.
-
Attach the file to your support ticket.
The following sections help you to solve problems related to high availability clusters.
This section explains the possible statuses of the syslog-ng Store Box (SSB) cluster and its nodes, the DRBD data storage system, and the heartbeat interfaces (if configured). SSB displays this information on the Basic Settings > High Availability page.
Status
The Status field indicates whether the SSB nodes recognize each other properly and whether those are configured to operate in high availability mode. The status of the individual SSB nodes is indicated in the Node HA status field of the each node. The following statuses can occur:
-
Standalone: There is only one SSB unit running in standalone mode, or the units have not been converted to a cluster (the Node HA status of both nodes is standalone). Click Convert to Cluster to enable High Availability mode.
-
HA: The two SSB nodes are running in High Availability mode. Node HA status is HA on both nodes, and the Node HA UUID is the same on both nodes.
-
Half: High Availability mode is not configured properly, one node is in standalone, the other one in HA mode. Connect to the node in HA mode, and click Join HA to enable High Availability mode.
-
Broken: The two SSB nodes are running in High Availability mode. Node HA status is HA on both nodes, but the Node HA UUID is different. Contact the One Identity Support Team for help. For contact details, see About us.
-
Degraded: SSB was running in high availability mode, but one of the nodes has disappeared (for example broken down, or removed from the network). Power on, reconnect, or repair the missing node.
-
Degraded (Disk Failure): A hard disk of the slave node is not functioning properly and must be replaced. To request a replacement hard disk and for details on replacing the hard disk, contact our Support Team.
-
Degraded Sync: Two SSB units were joined to High Availability mode, and the first-time synchronization of the disks is currently in progress. Wait for the synchronization to complete. Note that in case of large disks with lots of stored data, synchronizing the disks can take several hours.
-
Split brain: The two nodes lost the connection to each other, with the possibility of both nodes being active (master) for a time.
|

|
Caution:
Hazard of data loss In this case, valuable log messages might be available on both SSB nodes, so special care must be taken to avoid data loss. For details on solving this problem, see Recovering from a split brain situation.
Do NOT reboot or shut down the nodes. |
-
Invalidated: The data on one of the nodes is considered out-of-sync and should be updated with data from the other node. This state usually occurs during the recovery of a split-brain situation when the DRBD is manually invalidated.
-
Converted: After converting nodes to a cluster (clicking Convert to Cluster) or enabling High Availability mode (clicking Join HA) and before rebooting the node(s).
NOTE: If you experience problems because the nodes of the HA cluster do not find each other during system startup, navigate to Basic Settings > High Availability and select HA (Fix current). That way the IP address of the HA interfaces of the nodes will be fix, which helps if the HA connection between the nodes is slow.
DRBD status
The DRBD status field indicates whether the latest data (including SSB configuration, log files, and so on) is available on both SSB nodes. The master node (this node) must always be in consistent status to prevent data loss. Inconsistent status means that the data on the node is not up-to-date, and should be synchronized from the node having the latest data.
The DRBD status field also indicates the connection between the disk system of the SSB nodes. The following statuses are possible:
-
Connected: Both nodes are functioning properly.
-
Connected (Disk Failure): A hard disk of the slave node is not functioning properly and must be replaced. To request a replacement hard disk and for details on replacing the hard disk, contact our Support Team.
-
Invalidated: The data on one of the nodes is considered out-of-sync and should be updated with data from the other node. This state usually occurs during the recovery of a split-brain situation when the DRBD is manually invalidated.
-
Sync source or Sync target: One node (Sync target) is downloading data from the other node (Sync source).
When synchronizing data, the progress and the remaining time is displayed in the System monitor.
|
|
Caution:
When the two nodes are synchronizing data, do not reboot or shutdown the master node. If you absolutely must shutdown the master node during synchronization, shutdown the slave node first, and then the master node. |
-
Split brain: The two nodes lost the connection to each other, with the possibility of both nodes being active (master) for a time.
|
|
Caution:
Hazard of data loss In this case, valuable log messages might be available on both SSB nodes, so special care must be taken to avoid data loss. For details on solving this problem, see Recovering from a split brain situation. |
-
WFConnection: One node is waiting for the other node. The connection between the nodes has not been established yet.
Redundant Heartbeat status
If a redundant heartbeat interface is configured, its status is also displayed in the Redundant Heartbeat status field, and also in the HA > Redundant field of the System monitor. For a description of redundant heartbeat interfaces, see Redundant heartbeat interfaces.
The possible status messages are explained below.
-
NOT USED: There are no redundant heartbeat interfaces configured.
-
OK: Normal operation, every redundant heartbeat interface is working properly.
-
DEGRADED-WORKING: Two or more redundant heartbeat interfaces are configured, and at least one of them is functioning properly. This status is displayed also when a new redundant heartbeat interface has been configured, but the nodes of the SSB cluster has not been restarted yet.
-
DEGRADED: The connection between the redundant heartbeat interfaces has been lost. Investigate the problem to restore the connection.
-
INVALID: An error occurred with the redundant heartbeat interfaces. Contact the One Identity Support Team for help. For contact details, see About us.
It can happen that both nodes break down simultaneously (for example because of a power failure), or the slave node breaks down before the original master node recovers. The following describes how to properly recover syslog-ng Store Box (SSB).
NOTE: When both nodes of a cluster boot up in parallel, the node with the 1.2.4.1 HA IP address will become the master node.
To properly recover SSB
-
Power off both nodes by pressing and releasing the power button.
|
|
Caution:
Hazard of data loss If SSB does not shut off, press and hold the power button for approximately 4 seconds. This method terminates connections passing SSB and might result in data loss. |
-
Power on the node that was the master before SSB broke down. Consult the system logs to find out which node was the master before the incident: when a node boots as master, or when a takeover occurs, SSB sends a log message identifying the master node.
TIP: Configure remote logging to send the log messages of SSB to a remote server where the messages are available even if the logs stored on SSB become unaccessible. For details on configuring remote logging, see SNMP and e-mail alerts.
-
Wait until this node finishes the boot process.
-
Power on the other node.
