Monitoring process handling
You can allow monitoring of individual processes. The process information is updated regularly. The progress of a process step is displayed in the font color.
Table 3: Job queue display - meaning of the colors
|
Orange |
This process step is being processed. |
Processing |
|
Yellow |
This process step is loaded for processing. |
Loaded |
|
Green |
This process step is ready for processing. |
True |
|
Blue |
This process step has already been processed. |
Finished |
|
Black |
This process step is not ready for processing. |
False |
|
Red |
The process step being dealt with cannot be processed. You can re-enable process steps with Frozen status and therefore set them again for processing. |
Frozen |
|
Purple |
The process step being dealt with cannot be processed. You can re-enable process steps with Overlimit status and therefore set them again for processing. |
Overlimit |
|
Light purple |
The process step cannot be found. |
Missing |
To monitor information about a process
-
In the Job Queue Info, in the Job queue view or the Base objects view, select a process and select the Monitor process context menu entry.
The process information is updated regularly.
TIP: To display the objects affected by a process step, use the Affected objects view.
To monitor the entire Job queue
Details about process handling
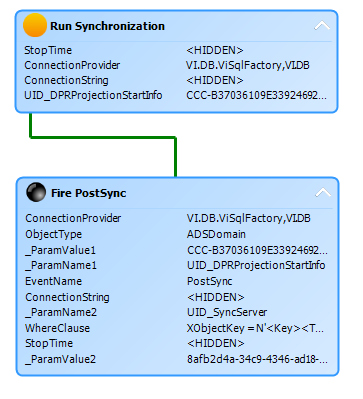
This view gives an overview of how process steps are linked within a process. In this way, the handling sequence of individual process steps for large processes can be monitored better.
To display details of the process handling
-
In Job Queue Info, select a process and select the View > Process menu item.
All the process steps of the selected process are displayed.
Figure 1: The process view

The process step and its properties are displayed through a special control element.
-
The process step name is displayed in the control's header.
-
The progress state of the process step is clarified by the use of a color icon ( ).
).
-
All other entries represent the parameters for this process step.
-
You can hide or show the parameter list by clicking on the 
 icons in the header of the control element.
-
Each control element entry has a tooltip.
Table 4: Displaying process's process steps - meaning of the colors
|
Orange |
This process step is being processed. |
Processing |
|
Yellow |
This process step is loaded for processing. |
Loaded |
|
Green |
This process step is ready for processing. |
True |
|
Blue |
This process step has already been processed. |
Finished |
|
Black |
This process step is not ready for processing. |
False |
|
Red |
The process step being dealt with cannot be processed. You can re-enable process steps that have Frozen or Overlimit status and therefore queue them again for processing. |
Frozen/Overlimit/unknown |
Details about handling process steps
In this view detailed information is displayed for each process step. The view shows the data structure for a process step at compilation time. After selecting a process step, specific information from the Job queue is mapped as well as each parameter of the selected process step with its values.
To display details of the process step handling
Table 5: Process step view - meaning of icons
|

|
Selection of a process step and its parameters. |
|

|
Displays a column from the Jobqueue table and the value. |
|

|
Displays a process step parameter and the value. |
TIP: You can copy the data currently selected in the view into the clipboard by pressing Ctrl + C. The data format is column name value.
Details of a process step's parameters
After selecting a process step, the passing parameters of the process step are displayed with their names and their values. If the selected node does not represent a process step, the parameter view is cleared.
To display process step parameters
-
In the Job Queue Info, select a process step and select the View > Parameter menu.
This shows all the parameters of the selected process step.
TIP: In the parameter view, you can copy the data selected parameter and its value into the clipboard using Ctrl + C. The data format is column name value.
Parameters that contain an object key are displayed as a link in the parameter view.
-
You can display the objects by clicking on the link or using the Show object properties context menu.
-
Use the Open in Object Browser context menu item to start the Object Browser and display the object.
-
For object keys that refer to a synchronization project, use the Open in Synchronization Editor context menu item to start the Synchronization Editor and load the synchronization project.
To support provisioning analysis, the CausingEntityPatch parameter is shown as a link. This parameter contains the patch that contains the changes to be provisioned.
-
Double-click on the link to open a separate dialog with the change information. You can also reach the dialog over the Show patch item of the parameter's context menu.
The change information lists the properties of the object before the change (old value) and after the change (new value). Changed properties are highlighted in color.
Error messages (ErrorMessages parameter) are displayed as links. Clicking on the link displays a detailed message.


 ).
).
 icons in the header of the control element.

