
Configure analytics
Select the analytics (also called algorithms) that you wish to use to analyze session data and enable them in SPS.
Session data is scored by any combination of algorithms that you enable. The scores given by algorithms are aggregated to create a single score.
During the aggregation process, the lowest and highest scores are removed. This is required in order to lower the number of false positives and false negatives. A typical attack is indicated by signs of unusual user behavior, unusual from multiple points of view. However, some things are usually perfectly normal about even the strangest sessions. This is why removing scores at the two extremes helps minimize the number of false positives and false negatives.
The following describes how to configure algorithms in SPS.
To configure algorithms in SPS
-
In SPS, go to Policies > Analytics Policies.
-
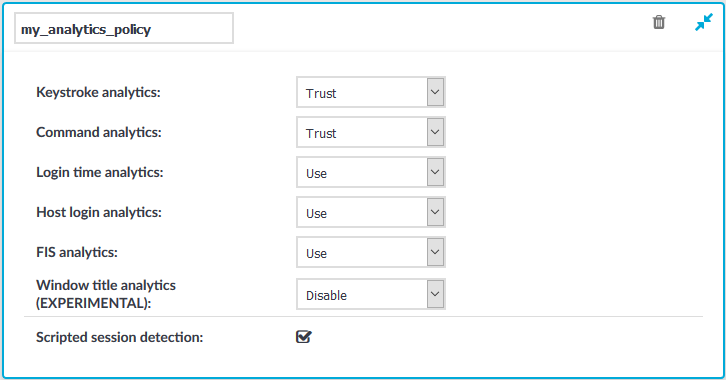
Enter a name for your analytics policy.
-
For each algorithm, select one of the following values:
-
Disable: Select this value if you do not want to use a particular algorithm.
-
Use: Select this value if you want to use a particular algorithm.
-
Trust: Select this value if you want to use a particular algorithm, and wish to include in the final aggregated score all the scores given by this algorithm.
Remember that during score aggregation, the lowest and highest scores are removed. You can choose to override this principle by selecting Trust for those algorithms that you wish to have a bigger weight in the final, aggregated, single score.
-
-
The Scripted session detection option is enabled by default. Decide whether or not you want to enable the detection of scripted sessions.
Scripted session detection is currently done by the clockmaster and gapminder algorithms.
-
Click
.
Figure 2: Policies > Analytics Policies — Recording an analytics policy
-
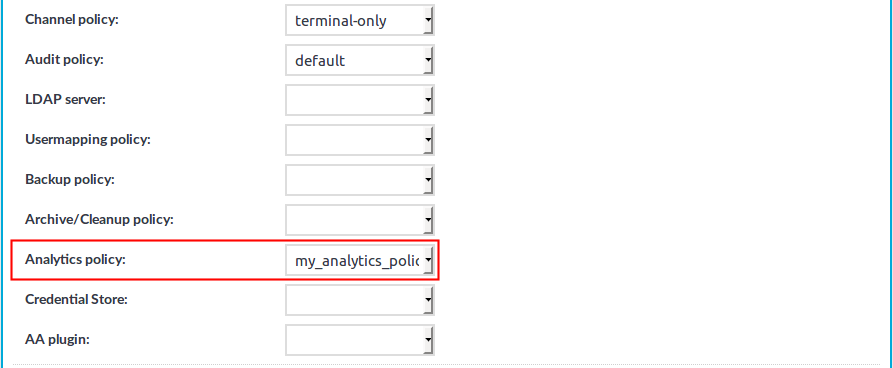
Go to <Protocol name> Control > Connections, and in the Analytics policy field, select the policy that you want to use for your connections.
Figure 3: <Protocol name> Control > Connections > Analytics policy — Adding an analytics policy to a connection policy
-
Click
Analyze data using One Identity Safeguard for Privileged Analytics
Prerequisites
Make sure that you have session data from network traffic that:
-
contains real, unique usernames linked to users other than root/administrator or a shared account
To check this, navigate to Search, and check whether the Username column contains data. This is important, because session data will be linked to users.
If you do not have unique usernames in your session data, review your authentication settings and consult with the One Identity Professional Services team to learn about your options to tie accounts to users.
-
has commands extracted (using lightweight or full indexing, or in real-time through content policies)
For instructions on how to configure indexing and include commands in the scope of indexing, see "Indexing audit trails" in the Administration Guide.
For details on how to configure real-time command extraction using a content policy, see "Creating a new content policy" in the Administration Guide.
-
has keystrokes extracted (using lightweight or full indexing, or in real-time through content policies)
The minimum required amount of data for reliable insight is 5 sessions with approximately 200 keystrokes each.
For instructions on how to configure indexing and include typing biometrics in the scope of indexing, see "Indexing audit trails" in the Administration Guide.
For details on how to configure real-time extraction of keystroke-related data using a content policy, see "Creating a new content policy" in the Administration Guide.
-
has window titles extracted (using lightweight or full indexing, or in real-time through content policies)
For instructions on how to configure indexing and include window titles in the scope of indexing, see "Indexing audit trails" in the Administration Guide.
For details on how to configure real-time window title extraction using a content policy, see "Creating a new content policy" in the Administration Guide.
The following describes how to start using SPA.
To start using SPA
-
Build the first baseline. You can do this in either of the following ways:
-
Wait for the daily periodic building to kick in (run by cron).
-
Log in through SSH into the core-shell, and then issue /opt/pam-pipeline/bin/build-baselines.
For the first run, running it with -ld (log to console and debug) is a good idea, it will not affect performance.
It might take a while for baseline building to complete if there is a lot of data, so it makes sense to run it in screen from a fixed node.
Baseline building is a periodical asynchronous process, meaning that incoming sessions do not immediately change the baseline.
-
-
Check if the baselines have been built:
-
Connect to PostgreSQL, the database that permanently stores the outcome of any analyses performed by SPA for later display on the Search interface:
psql -U paa paa
-
Issue SQL queries to get a list of users for whom a baseline has been built:
-
For the keystroke algorithm, use:
select distinct user_id from keystroke;
-
For the command algorithm, use:
select distinct user_id from command;
-
For the login time algorithm, use:
select distinct user_id from logintime;
-
For the host login algorithm, use:
select distinct user_id from hostlogin;
-
For the fis algorithm, use:
select distinct user_id from fis;
-
For the window title algorithm, use:
select distinct user_id from windowtitle;
-
For the clockmaster algorithm, use:
select distinct user_id from clockmaster;
-
Scoring only happens when there is a baseline.
-
-
Start getting scores.
Scoring happens in real-time, meaning that as soon as new data (even data from an ongoing session) is available, SPA immediately scores it.
TIP: When data is not immediately available to you and you are unable to wait until sufficient amount of data comes in from production traffic, you can resort to the following:
-
Manually reindex historical sessions. For details, see "Reindex historical sessions" in the Safeguard for Privileged Analytics Configuration Guide.
-
Specifically for window title data, run the pam-process-historical-window-titles command to invoke window title processing for sessions that have been both closed and indexed.
This can be useful, for example, when you have upgraded from a SPS version earlier than 5 F6 or you simply have never used the window title algorithm, and therefore SPS has not done any window title processing before.
Scores represent an aggregated amount. Session data is scored by multiple algorithms independent from each other. Scores given by individual algorithms are aggregated to create a single score.
-
-
Search for sessions with high scores.
-
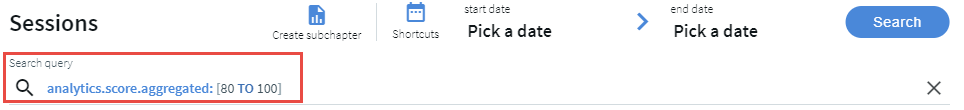
Go to Search.
Sessions are displayed sorted by date. For ongoing sessions, the Search interface is updated in real-time to always show the most up-to-date information.
-
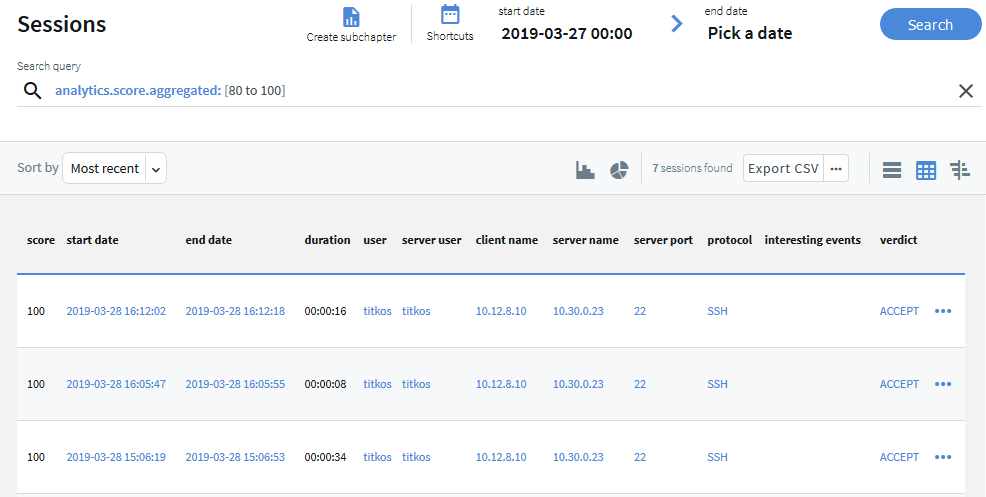
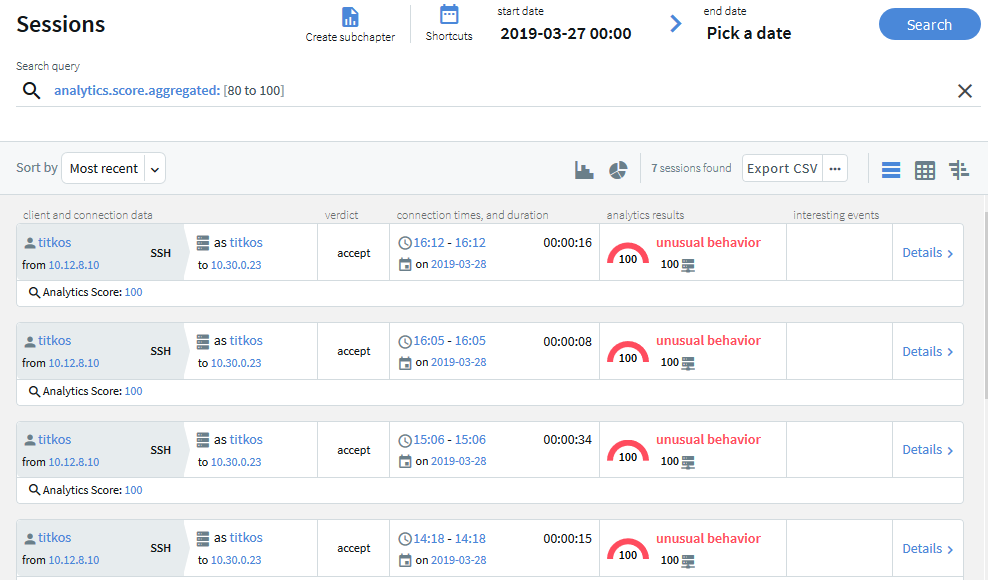
In the Search query field, type analytics.score.aggregated: [80 TO 100], and click Search.
A score between 80 and 100 indicates unusual user behavior.
Figure 4: Searching for sessions with unusual user behavior using a search query
Results that show sessions with high scores are displayed.
Figure 5: Sessions with high scores — table view
Figure 6: Sessions with high scores — card view
For detailed instructions on how to search effectively and replay audit trails that contain interesting events, see "Using the Search interface" in the Administration Guide.
-
-
Alternatively, search for scripted sessions.
In the Search query field, type analytics.scripted:true, and click Search.
-
To view details of a session, click
when you are in card view.
Alternatively, click
when you are in table view.
-
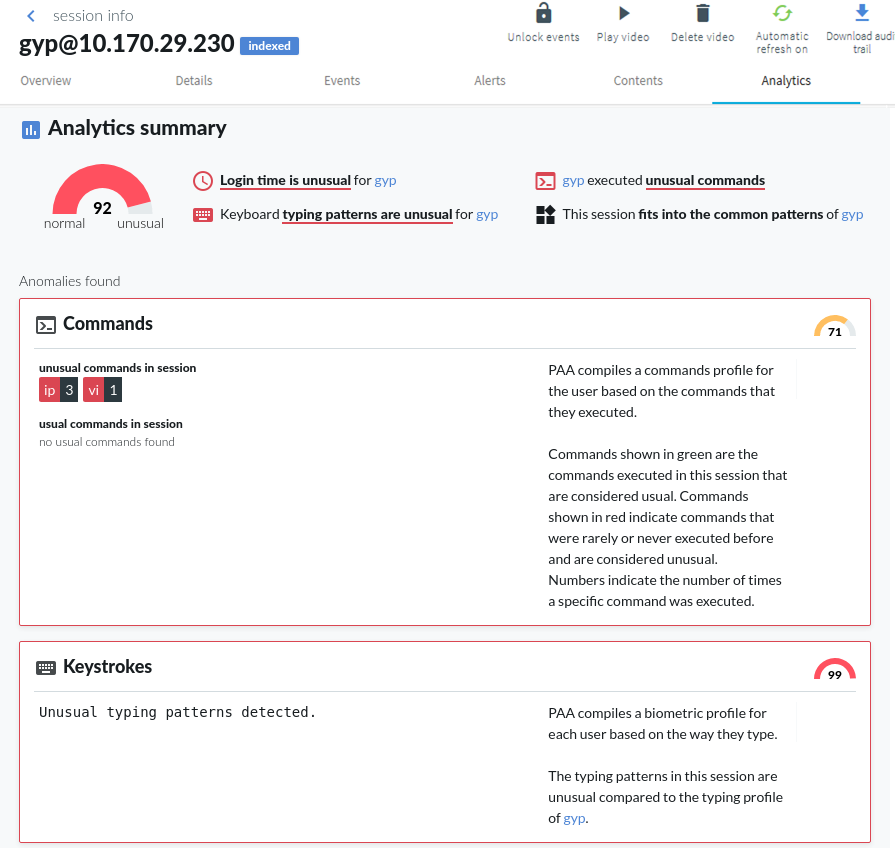
Click the Analytics tab.
The top of the page displays a summary of key insights about the session, such as:
-
The aggregated score (indicated by a gauge). The following color codes are used:
-
Scores between 80-100 indicate unusual behavior, their color code is red.
-
Scores between 70-79 indicate behavior that might require further analysis and attention, their color code is amber.
-
Scores between 0-69 indicate normal behavior, their color code is gray.
-
-
A one-sentence summary of each algorithm's verdict about the session and user behavior.
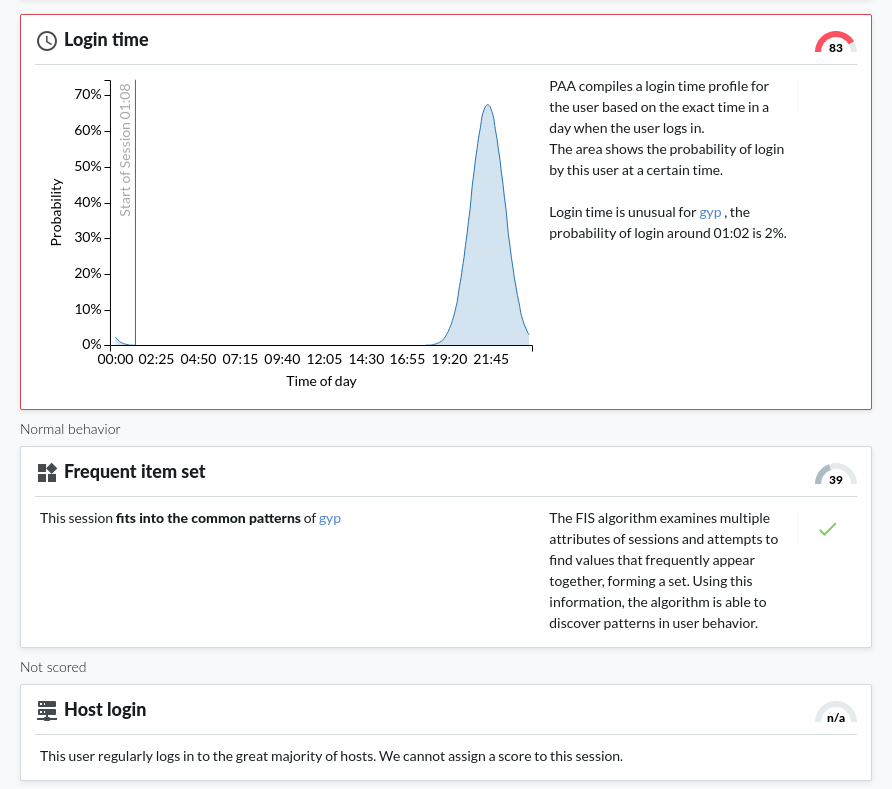
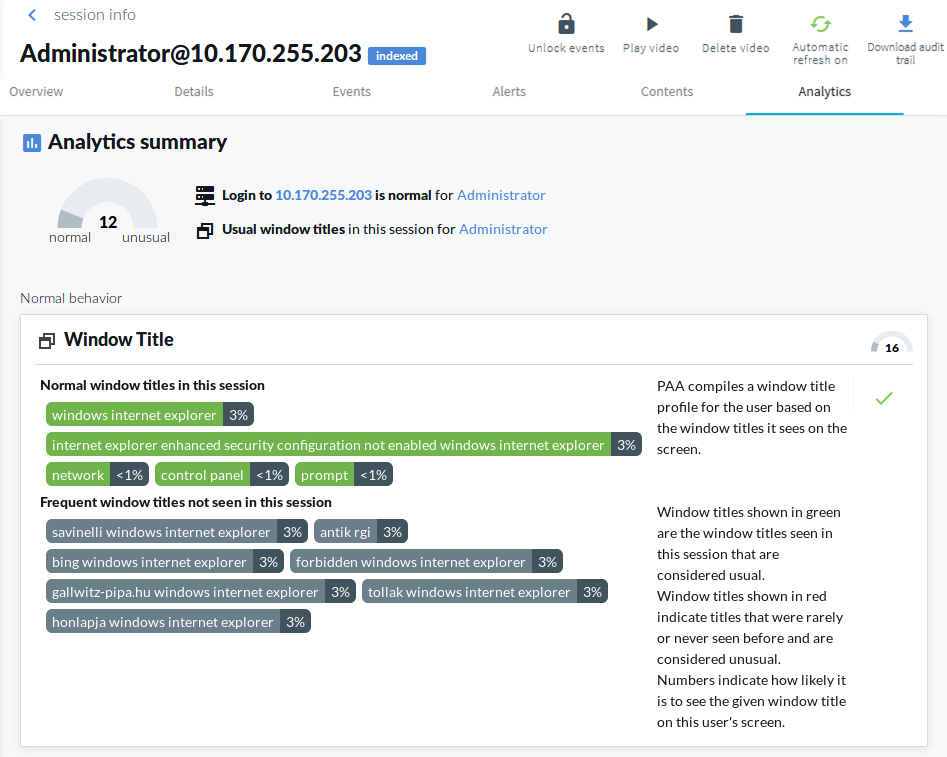
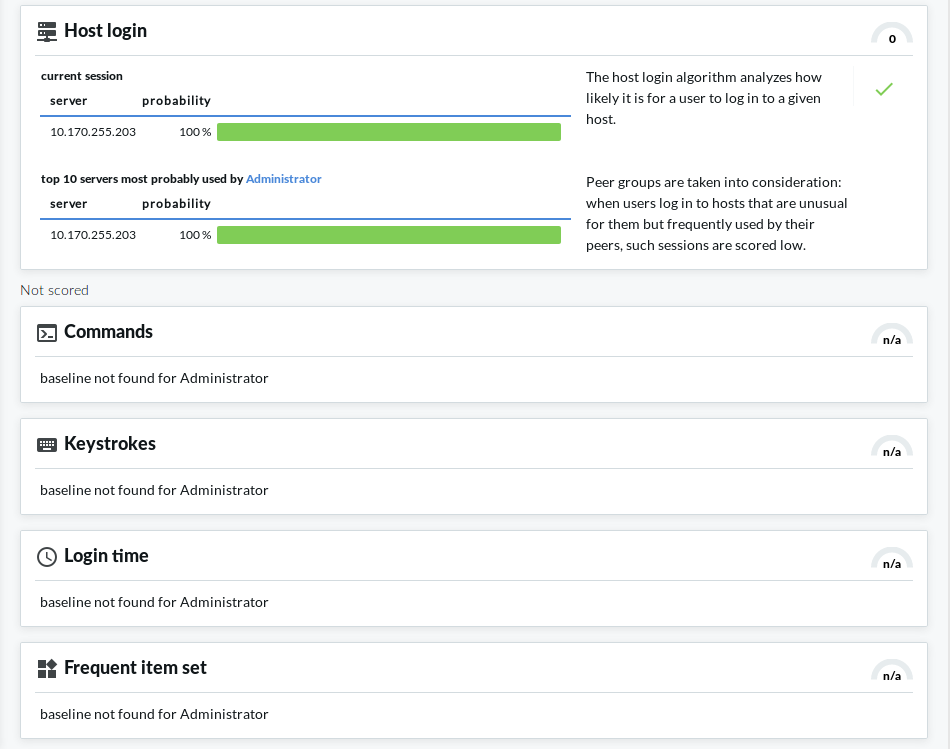
The Anomalies found and Normal behavior sections of the page display detailed analyses provided by each of the configured algorithms. This includes short information on how a particular algorithm works and how to read the visualized insight, as well as scores given by the individual algorithms.
Figure 7: Search — Viewing details on the Analytics tab: Anomalies found
Figure 8: Search — Viewing details on the Analytics tab: Normal behavior
-

Reindex historical sessions
When data is not immediately available to you and you are unable to wait until sufficient amount of data comes in from production traffic, you can resort to manual reindexing. For more information, contact our Professional Services Team.