You can quickly sort and visualize the distribution of the sessions based on their various metadata, for example, username, server address, and so on.
To display statistics on search results
-
Click the
icon.
-
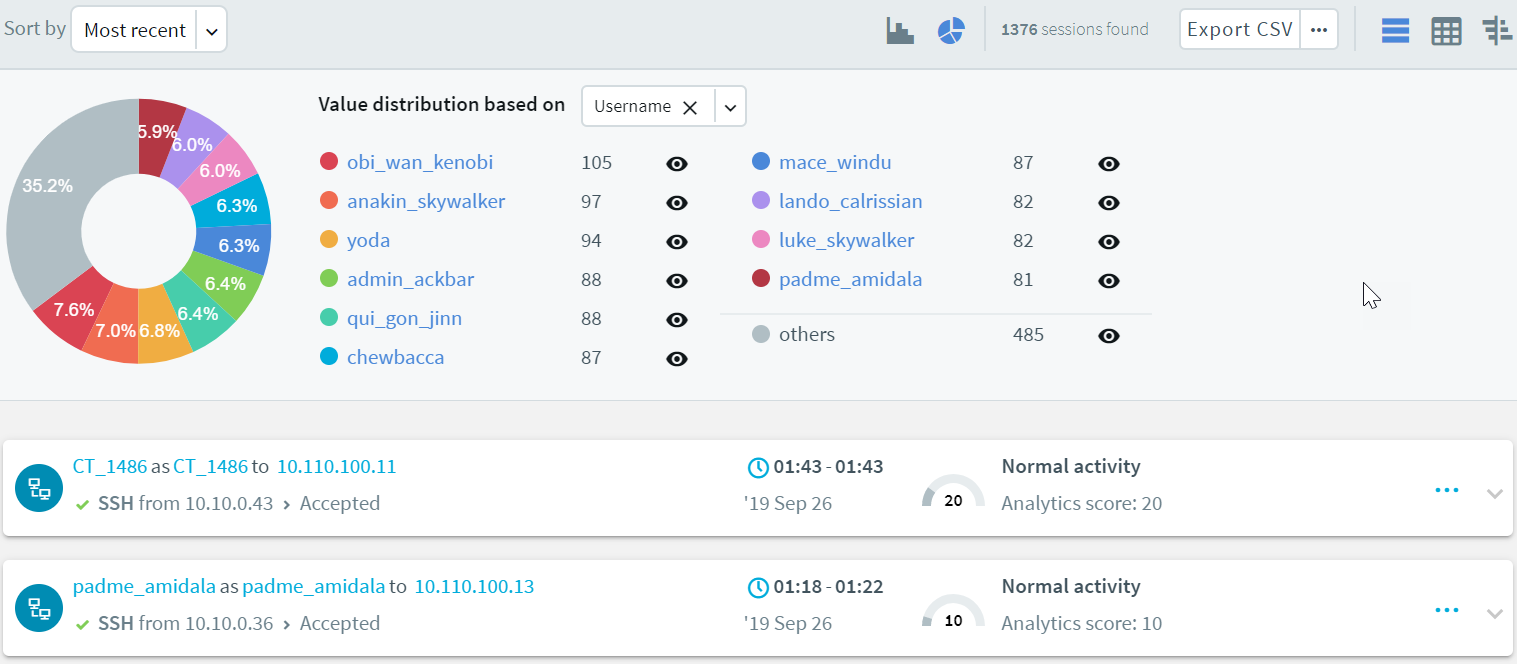
Select the type of metadata you want to create statistics on from the Value distribution based on field, for example, select Username to display sessions based on username.
Figure 149: Sessions — Displaying statistics
-
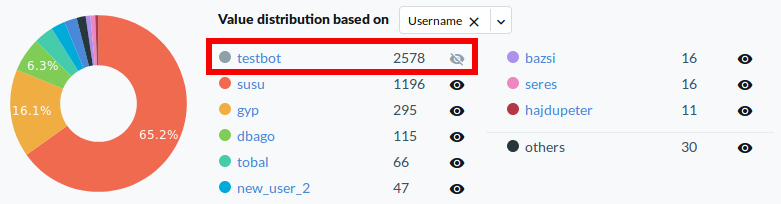
To exclude items from the pie chart, click the
icon next to the metadata you want to exclude.
For example, if you want to exclude results by a user called testbot, select the
Figure 150: Sessions — Excluding items from the pie chart
The pie chart now does not display results for the excluded item. The percentages always add up to 100%.
You can continue to restrict or refine your search results and view statistics as required.