Using simple reports in statistics
Simple reports that you create in the Manager can be displayed as statistics in the Manager's info system. To do this, you must alter the Manager's user interface in the Designer. In the Manager's info system, the report opens when you double-click on the statistic's header.
For more information about how to create reports in the Manager, see the One Identity Manager Report Subscriptions Administration Guide.
To display a simple report in the statistics
-
In the Designer, create a user interface form.
-
In the Designer, select the User interface > Forms > User interface forms category.
-
Select the Edit form task.
-
Select the Form > Insert menu item.
-
Edit the interface form's main data.
Take the following cases into account:
-
Use the VI_Report form definition.
This form definition is configured for displaying in the graphical user interface and in web applications. You only need to set up one interface form for this. Which form template will be used to display the interface form is decided dynamically, depending on usage.
-
In the form’s configuration data, enter the UID of the simple report (RPSReport.UID_RPSReport) in the Properties section.
Syntax:
<DialogSheetDefinition FormatVersion="1.0">
<Properties>
<Property name="UIDRPSReport">UID_RPSReport from the RPSReport</Property> table
</Properties>
</DialogSheetDefinition>
-
Assign the user interface form to the Manager program and the permissions groups.
-
In the Designer, create a menu item.
-
In the Designer, select User interface > User interface navigation category.
-
In the User Interface Editor, select the menu item for the statistics item to show the report.
-
Select New.
-
Edit the main data of the menu item.
-
Assign the menu item to the Manager application and permissions groups.
-
Assign the user interface form to the menu item.
-
Select the Database > Save to database and click Save.
Related topics
Diagram types for visualizing statistics
There are several diagram types available for visualizing statistics.
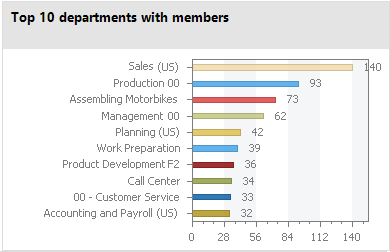
Bar chart
A bar chart can be used to visualize comparisons between measurements. The actual measurement of the ElementValue column and the identifier for ElementName column are used to label the diagram.
Figure 17: Bar chart example
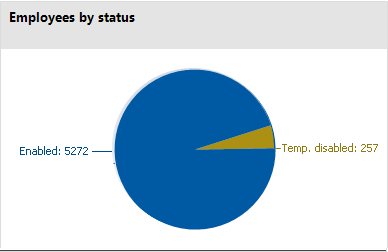
Pie chart
A pie chart can be used to visualize the measurements as a percentage of the base measurement. The actual measurement of the ElementValue column and the identifier for ElementName column are used to label the diagram.
Figure 18: Pie chart example
Line diagram
A line diagram can be used to visualize a data sequence over a specified time period. The time axis is scaled in proportion to the time scale given in the statistic definition. The number of measurements in the line diagram results from measurement runs that are entered in the statistic definition from the history data. Click with the mouse on a point of measurement and a tooltip showing the measurement is displayed.
Figure 19: Line diagram example

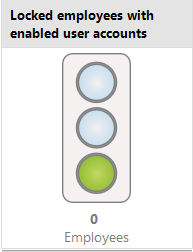
Traffic light
A traffic light diagram can be used to visualize the state of the system. The state is indicated by the color. The threshold factors given in the statistic definition determine when which status is reached.
Table 56: Meaning of the colors
|
Green |
correct |
|
Yellow |
acceptable |
|
Red |
unacceptable |
The actual measurement of the ElementValue column and the identifier for ElementName column are used to label the diagram.
Figure 20: Traffic light example
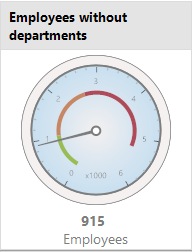
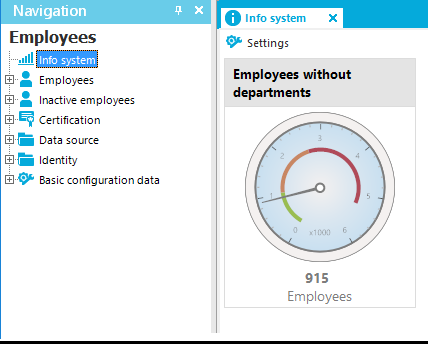
Tachometer
A tachometer diagram can be used to visualize the state of the system in more detail than in a traffic light diagram. The base measurement is also displayed. The state is indicated by the color. The threshold factors given in the statistic definition determine when which status is reached. The actual measurement of the ElementValue column and the identifier for ElementName column are used to label the diagram.
Figure 21: Tachometer diagram example
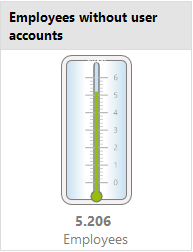
Thermometer
A thermometer diagram can be used to visualize the state of the system in more detail that in a traffic light diagram. The state is indicated by a color scale on the side of the diagram. The threshold factors given in the statistic definition determine when which status is reached. The actual measurement of the ElementValue column and the identifier for ElementName column are used to label the diagram.
Figure 22: Thermometer diagram example
Table
This diagram type can be used to visualize the measurements in table form. Enter a number of archived measurements runs in the statistic definition, to present the data over a specified time period.
Figure 23: Table example

Examples of statistic definitions
Example 1:
The number of people in the company should be displayed in the statistics. This statistic should be calculated daily. The statistics definition could look like:
|
Statistic: |
CountEmployees |
|
Display name: |
Number of employees |
|
Description: |
Finds the number of employees in the company on a daily basis. |
|
Calculation schedule: |
Calculate statistics |
|
Measurements query: |
select 'Employees' as ElementName, count (*) as ElementValue from Person |
To display the statistics in the Manager in the Employees > Info system category, the following menu item is created:
|
Menu item: |
Person.InfoSystem.CountEmployees |
|
Item type: |
Statistics |
|
Sort order |
1 |
|
Statistic: |
Number of employees |
|
Diagram type: |
Thermometer |
The menu item is assigned to the Manager program and an application role and can then be displayed in the Manager.
Figure 24: Displaying statistics in the Manager
Example 2:
The number of external employees in the company should be displayed in the statistics. This statistic should be calculated weekly. If more than 20% of employees in the company are externals, the info system should display the state as acceptable instead of a correct. If more than 80% are externals the state should be unacceptable.
|
Statistic: |
CountExternalEmployees |
|
Display name: |
Number of external employees. |
|
Description: |
Find the number of external employees in the company on a weekly basis. |
|
Calculation schedule: |
Calculate weekly statistics |
|
Measurements query: |
Select 'Employees' as ElementName, Count (*) as ElementValue
from Person where IsExternal = 1 |
|
Base measurements query: |
Select 'Employees' as ElementName, Count (*) as ElementValue
from Person |
|
Threshold green: |
0.2 |
|
Threshold red: |
0.8 |
To display the statistics in the Manager in the Employees > Info system category, the following menu item is created:
|
Menu item: |
Person.InfoSystem.CountExternalEmployees |
|
Item type: |
Statistics |
|
Sort order |
2 |
|
Statistic: |
Number of external employees. |
|
Diagram type: |
Traffic light |
The menu item is assigned to the Manager program and an application role and can then be displayed in the Manager.
Example 3:
The number of employees, for which the current user is entered directly as manager, should be represented in a statistic. Restrictions to the values for the current user are made though a condition.
|
Statistic: |
CountEmployeesPersonHead |
|
Display name: |
Supervised employees |
|
Description: |
Finds the number of employees for which the manager is responsible on a daily basis. |
|
Calculation schedule: |
Calculate statistics |
|
Measurements query: |
select XObjectKey as ElementObjectKey, 'Employees' as ElementName, Count (*) as ElementValue
from Person where IsExternal = 1
Group by XObjectKey |
|
Condition: |
ElementObjectKey in
(select XObjectKey from Person where uid_PersonHead = '%useruid%') |
Configure the web project in the Web Portal, to display statistics in the Web Designer info system.
Example 4:
Internal and external employees, which the current user supervises as department manager, should be represented in a statistic. Departments are added here separately to determine clear results for displaying the measurement because a department manager might be responsible for more than one department.
|
Statistic: |
PersonCountInternalExternal_By_Department |
|
Display name: |
Number of internal and external employees |
|
Description: |
Finds the number of internal and external employees per department on a daily basis. |
|
Calculation schedule: |
Calculate statistics |
|
Measurements query: |
select d.XObjectKey as ElementObjectKey, 'Internal' as ElementName, count(p.uid_person) as ElementValue
from Department d Left Outer Join Person p on p.UID_Department = d.UID_Department and p.IsExternal = 0
Group By d.XObjectKey
UNION ALL
select d.XObjectKey as ElementObjectKey, 'External' as ElementName, count(p.uid_person) as ElementValue
from Department d Left Outer Join Person p on p.UID_Department = d.UID_Department and p.IsExternal = 1
Group By d.XObjectKey |
|
Condition: |
ElementObjectKey in
(select d.XObjectKey from Department d join helperheadorg hpo on d.UID_Department = hpo.UID_Org where hpo.UID_PersonHead = '%useruid%') |
|
Aggregate function |
SUM |
Configure the web project in the Web Portal, to display statistics in the Web Designer info system.
Example 5:
Ten employees with the highest risk index should be found and displayed in a statistic. They should be sorted by measurement unit.
|
Statistic: |
Top10ActivePersonByRiskIndex |
|
Display name: |
Top 10 active employees by risk index |
|
Description: |
Find ten active employees with the highest risk indexes on a daily basis. |
|
Calculation schedule: |
Calculate statistics |
|
Measurements query: |
select top 10 p.InternalName as ElementName,
Round(100 * IsNull(p.RiskIndexCalculated, 0), 0) as ElementValue,
p.XObjectKey as ElementObjectKey,
ROW_NUMBER() over (order by IsNull(p.RiskIndexCalculated, 0) desc, p.InternalName) as ElementOrder
from Person p
where p.IsInActive = 0
order by ElementOrder |
Configure the web project in the Web Portal, to display statistics in the Web Designer info system.
Extending the Launchpad
The Launchpad is the central tool for starting One Identity Manager administration tools and configuration tools. You can use the Launchpad to check the existing One Identity Manager installation and start One Identity Manager tools to run individual tasks.
The Launchpad can be customized. In the Designer, you can define your own menu items and actions for the Launchpad.
You can control how and where menu items are displayed in the Launchpad. You use the menu hierarchy and the different types of menu items to do this. For more information about the structure of a menu hierarchy and the individual menu items and their properties, see User interface navigation.
One Identity Manager supplies a number of Launchpad actions that you can use to start applications by using the Launchpad. You can also start your own applications over the Launchpad.
Detailed information about this topic
