
Viewing session details for data recorded by SPS
From the Search interface, you can view session details for data recorded by SPS. To view session details for data recorded by Safeguard for Privileged Passwords (SPP), see Viewing session details for data recorded by SPP.
The 
To view session details, click the 
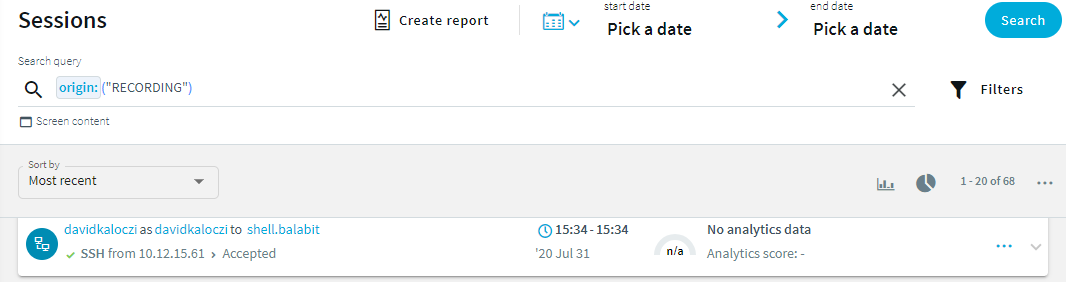
Figure 23: Search — Accessing session details
Figure 24: SPS session details
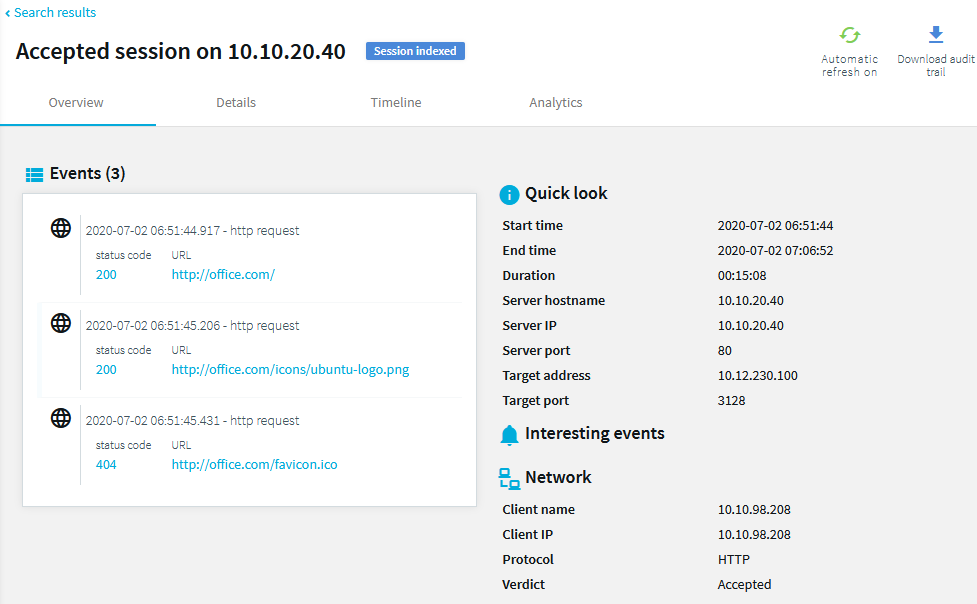
The session details window provides details about the sessions on tabs.
Overview tab
The Overview tab is divided into the following main areas:
-
The Events area displays session events in chronological order.
View the date and time of the event, the event type and event details. To filter events, use the Timeline tab.
- The Score area shows the risk score that the Analytics Module assigned to the session. Ranges from 0 to 100, 100 is the highest risk score.
-
The Quick look area contains user information, for example, gateway and server username, start and end time of the session, and so on.
The gateway username corresponds to the Username field of the connection metadata database, so note the following:
-
If the user performed inband gateway authentication in the connection, the field contains the username from the gateway authentication (gateway username).
-
Otherwise, the field contains the username used on the remote server.
-
-
The Interesting events area displays events selected as interesting, for example, a list of commands and window titles from the session that could be interesting from a security point of view.
The list of interesting events is currently hard-coded and cannot be modified. For terminal sessions it includes commands such as chmod, ssh, shutdown, sudo, su, mount, adduser, addgroup. For graphical sessions, it contains window titles such as Management Console, Control Panel, Server Manager, PowerShell, Security Settings, Windows Security Center.
-
The Network area displays session information, for example, verdict, protocol, connection policy, client and server address.
Details tab
In addition to the Quick look, Interesting events, and Network screen areas, the Details tab provides monitoring information, audit trail downloads information, and channels information, too.
If there is a gateway authentication or authorization failure due to an AA plugin, the reason of the failure is displayed in the Deny reason field.
Timeline tab
From the Search interface, for data recorded by SPS, you can view session events and alerts on a timeline, and search in the contents of the audit trail. The Timeline tab replaces the now deprecated Events, Alerts, and Contents tabs.
Figure 25: Timeline tab
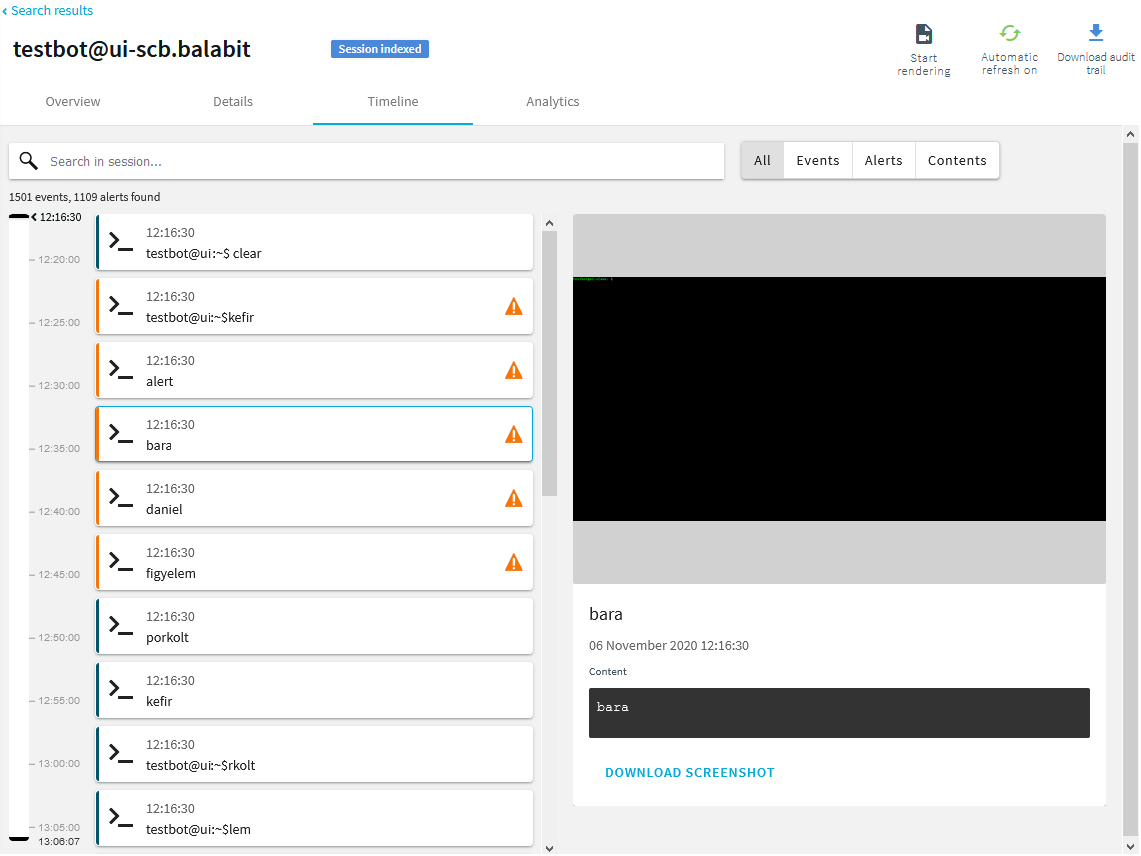
Events:
-
Session events in chronological order.
You can narrow the event list by entering the event name in the Search in session field.
-
Date and time of the event.
-
Event type (command, screen content, window title).
-
Event details.
-
Screenshots.
Alerts:
-
Content policy alerts triggered in the session, in chronological order.
You can narrow the alert list by entering the alert name in the Search in session field.
-
Date and time of the alert.
-
Alert details.
-
Screenshots.
Contents:
You can search in the contents of the audit trail using plain-text search. Searching using complex keyphrases is not supported from the Timeline tab.
Screenshots:
Screenshots. If screenshots are available for the session, you can click each event or alert to view the corresponding screenshot.
Screenshots are not available for:
-
Ongoing sessions.
-
Unindexed sessions.
-
Trails of HTTP sessions.
-
Encrypted trails (without the necessary certificate).
If screenshots are encrypted, you have to upload the necessary encryption key to your keystore. For more information, see Viewing encrypted screenshots.
Analytics tab
If you use the One Identity Safeguard for Privileged Analytics, you can view detailed analyses provided by the configured algorithms. For more information, see
Viewing active connections
If a connection is not closed and is still active, the 
To close an active connection, click the 
You can also view the live connection as follows:
-
Click the
label.
-
Download the audit trail.
Trail data is exported in .srs format, which you can open with the Safeguard Desktop Player application.
For more information on the Safeguard Desktop Player, see Safeguard Desktop Player User Guide.