Configuring the internal indexer
Indexing audit trails allows you to search in the content of the audit trails, for example, to search for specific texts that the user has seen or typed in the session. The following describes how to configure SPS to index the audit trails. For details, see Configuring the internal indexer.
To configure SPS to index the audit trails
-
Navigate to Basic Settings > Local Services > Indexer service, and select Indexer service.
-
Define the Maximum parallel audit trails to index on box. The default value is set to the number of detected CPU cores.
-
(Optional) If you have encrypted audit trails and you want to index them, upload the necessary RSA keys (in PEM-encoded X.509 certificates).
-
Click
.
-
Navigate to Policies > Indexer Policies.
-
To create a new Indexer Policy, click
.
-
To configure what languages to detect, select Manual language selection. Select the language(s) to detect.
-
Navigate to the Control page of the traffic type (for example SSH Control), and select the connection policy to index.
-
Select Enable indexing.
-
To determine the priority level of indexing this connection, select the appropriate Priority level.
-
Select the Indexing Policy to be used.
-
Click
-
Check which channel policy is used in the connection, and navigate to the Connection policies page.
-
Select the channel policy used in the connection to index, and verify that the Record audit trail option is selected for the channels you want to index (for example, the Session shell channel in SSH, or the Drawing channel in RDP).
-
Click
-
Test the new configuration: try to initiate a connection from the client (your computer) to the server.
-
After successfully connecting to the server, do something in the connection, for example, execute a simple command in SSH (for example, ls /tmp), or launch an application in RDP (for example, the Windows Explorer), then disconnect from the server.
-
Navigate to Search on the SPS web interface. Your sessions are displayed in the list of connections. Note that for the transparent connection, the client addresses the target server, while the non-transparent connection addresses SPS.
-
Click the
 icon. A summary will be displayed about the connection. Enter a text that was displayed in the connection into the search box, for example, the command you executed in SSH, or a menu item or other text you have seen in RDP (for example, Start). SPS will automatically generate a screenshot showing when the text was displayed in the connection.
Using the Search interface
This section provides an overview on how to use the Search interface. It describes how you can access the Search interface, lists the steps to take to search effectively, view the details of a connection, replay the audit trails, or export the search results as a comma-separated text file.
Prerequisites
Users need the Search privilege to access the Search interface.
NOTE: Assigning the Search privilege to a user on the Users & Access Control > Appliance Access page, automatically enables the Search in all connections privilege, and grants the user access to every audit trail, even if the user is not a member of the groups listed in the Access Control option of the particular connection policy.
If you want users to access audit trails only for connections for which they are granted permission, see
For information on configuring:
-
Authorizers for a connection, see
-
User rights, see
-
To access the Search interface, navigate to Search.
Sessions are displayed sorted by date. For ongoing sessions, the Search interface is updated in real-time to always show the most up-to-date information.
You can view sessions in a card, table or flow view. Click
for more details and select from the list.
-
Specify a date and time range to restrict your search criteria as described in Specifying time ranges.
-
Filter connections as described in Using search queries.
-
Search the contents of audit trails as described in
-
View connection details as described in Viewing session details.
-
Download and replay audit trails as described in
-
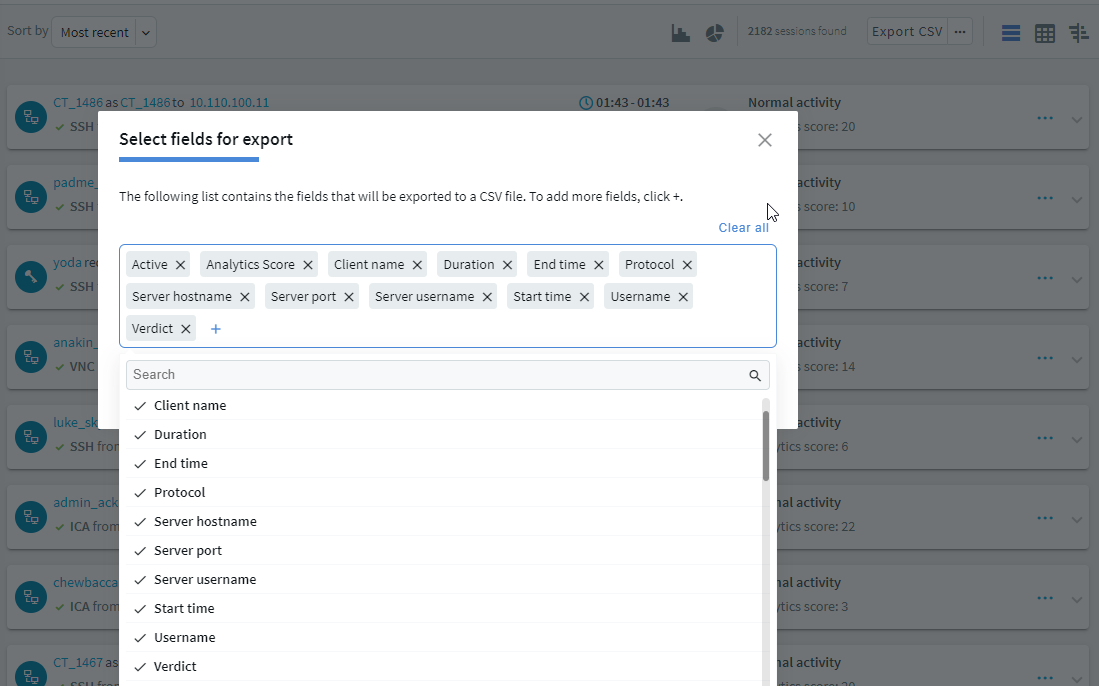
To export the search results as a comma-separated text file, click
To customize which fields are exported, click
Specifying time ranges
Specify a time range to restrict, or filter your search criteria by setting boundaries on your searches. You can restrict the search to one of the preset time ranges, or use a custom time range for a more specific search.
When you specify a time range, the search result includes:
-
Connections started and finished anywhere between the start time and end time you specified.
-
Connections started anywhere between the start time and end time you specified.
-
Connections ended anywhere between the start time and end time you specified.
-
Active connections if they were started anywhere between the start time and the end time you specified.
For example, at 17:00 PM you specify a start date of 10:00 AM and end date of 15:00 PM for your search. The search result includes:
-
Connections started at 8:00 AM and ended at 14:00 PM.
-
Connections started at 11:00 AM and ended at 14:00 PM.
-
Connections started at 11:00 AM and ended at 16:00 PM.
-
Active connections started at 11:00 AM.
-
Active connections started at 10:00 AM.
To specify time ranges
-
To select the start date of your search, click Pick a date.
Alternatively, use the
(shortcuts) button to restrict the search to one of the preset time ranges. For example, to investigate an incident that occurred sometime in the last hour, you can select Today, but a better option is Last 60 minutes.
Figure 13: Search — Pick a date
-
From the calendar, select the start date as required.
NOTE: The date refers to the timezone configured on SPS.
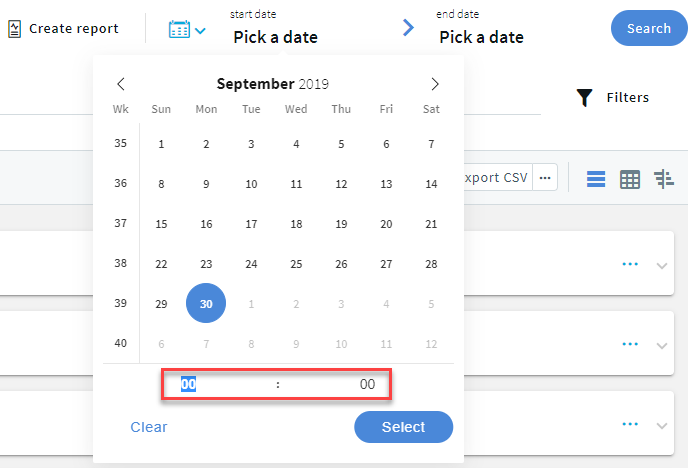
-
For exact time ranges, specify to search by the hour and minute.
Figure 14: Search — Specify hour and minute
-
To select the end date of your search, click Pick a date and select a date as required.
If you specify only the start date, the end date is set to the current time.
-
Optional: To clear the start and end date, click
-
Optional: You can use the timeline for a quick time range selection and visual representation of sessions in the selected interval.
-
Click the
icon.
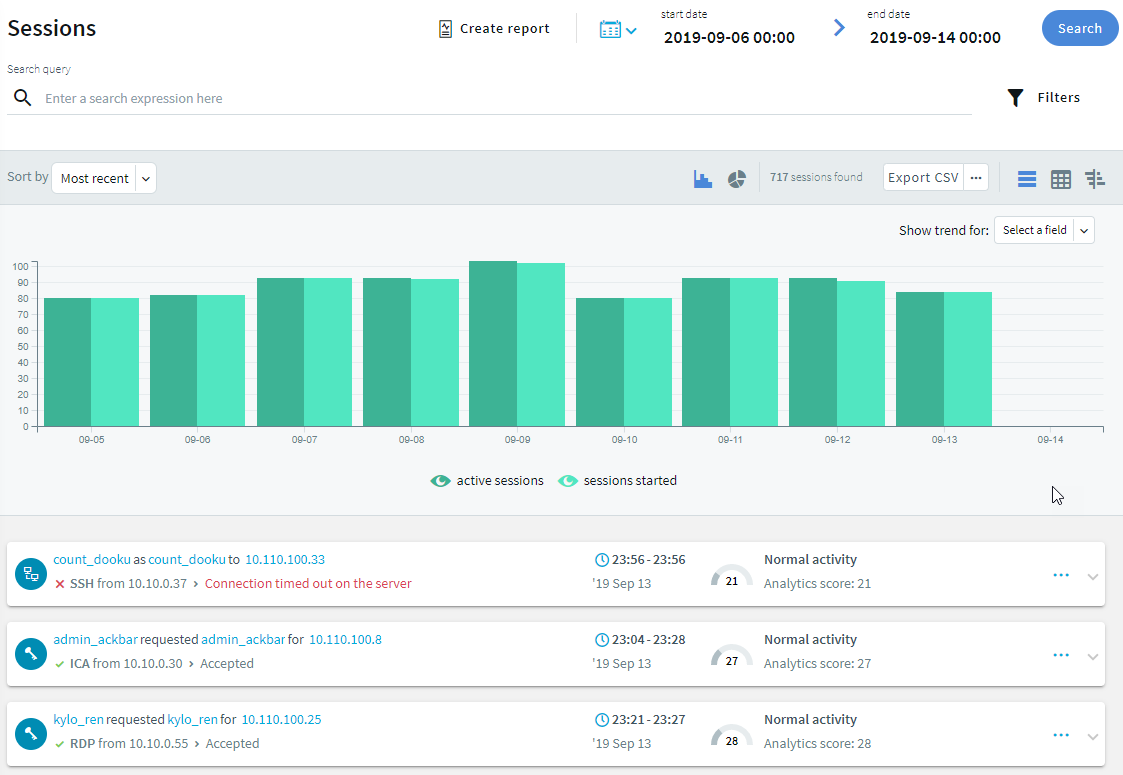
Figure 15: Search — Using the timeline
The bars display the number of results in the selected interval.
The active sessions columns indicate all the sessions, which were active in the selected interval. The sessions started columns indicate all the sessions started during the selected interval. For example, if the selected interval is today between 8:00 AM and 9:00 AM, then a session started at 7:00 AM but lasting after 8:00 AM is displayed in the active sessions column. A session started at 8:30 AM is displayed in the sessions started column. Since the session was active during the selected time interval, the session started at 8:30 AM is also displayed in the active sessions column.
To disable the active sessions and view only the started sessions in the timeline, click
. To disable the started sessions and view only the active sessions in the timeline, click
.
Hovering the mouse above a bar displays the number of entries and the start and end date of the period that the bar represents.
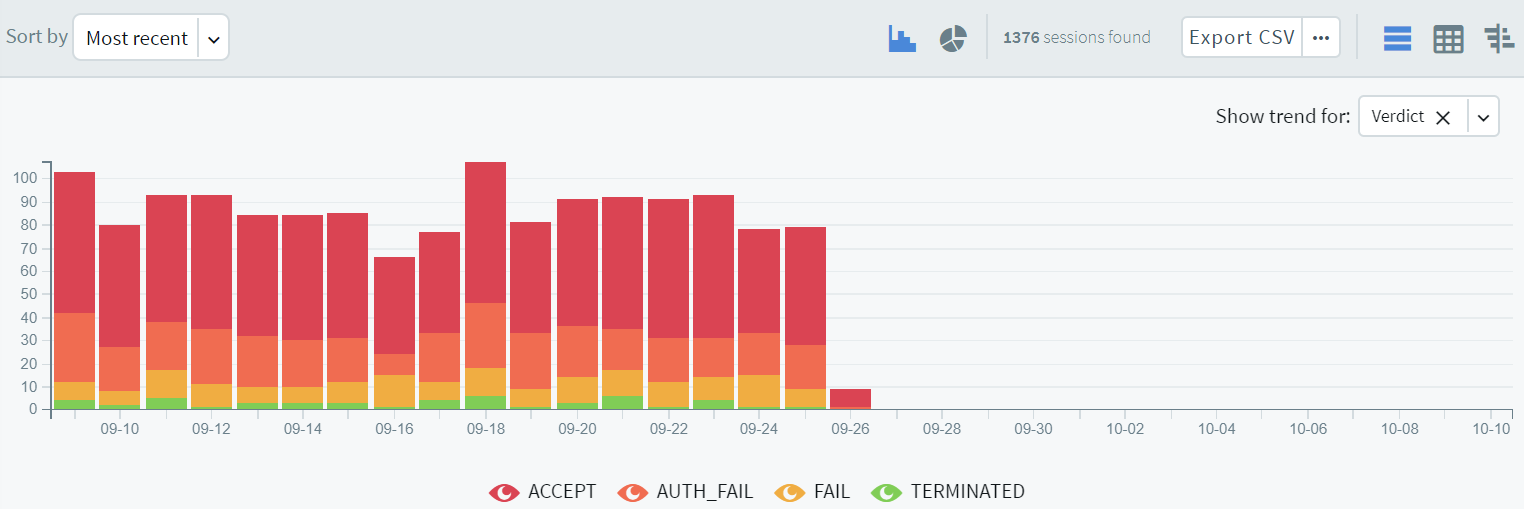
Trend analysis allows you to use the timeline to find changes over time. For example, to find the time range where terminated connections had a significant peak compared to other days, from the Show trend for drop-down menu, select Verdict. Note that you can only view trend analysis for Active, Analytics Score, Client name, Protocol, Server hostname, Server port, Server username, Username and Verdict. All the other selections are grayed out.
The colors of the bars in the timeline allow you to quickly find the time range with a higher number of terminated sessions.
Optional: To clear the trend analysis view, from the Show trend for drop-down menu, select X.
Figure 16: Search — Using the timeline - trend analysis
-
To select a range, drag the mouse pointer across the timeline or use Shift+Click and select multiple bars.
-

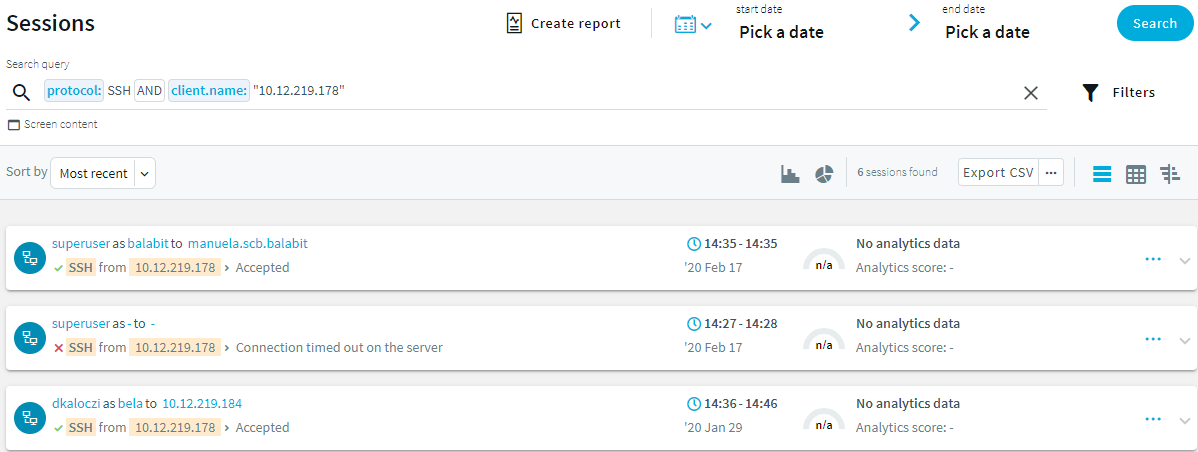
Using search queries
The following describes how you can use search queries to perform a more specific search.
To search using search queries
-
Enter a search query in the Search query field, or click on an entry in the table.
To search, enter a valid search field followed by a value in the search field: VALUE format. For example, if you enter protocol: SSH, the search returns all the SSH sessions.
TIP: Search is case insensitive. To make the search case sensitive, enclose the search keywords in double quotes.
The search queries can include only alphanumerical characters. You can use complex expressions and boolean operators, for example, AND, OR, <,>, and so on.
For the list of search fields that you can use, see
For more information on how to use more complex keyphrases that are not covered in this guide, see the Apache Lucene documentation.
There are search fields that are not displayed but you can still use them to query the sessions. For example, you can search for active connections using the active search field, and search results are listed accordingly, but there is no active field displayed in the search table or in the Overview, Details, and Timeline tabs.
Figure 17: Search — Search queries
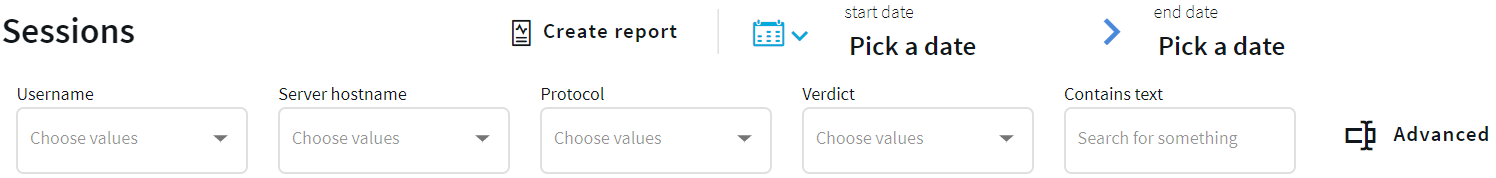
Alternatively, click
and set the filters you need from the appropriate columns. For example, to search for a specific username, select it using the drop-down menu of the Username column. For a more generic search, you can enter any text in the Contains text column.
Figure 18: Search — Search filters - Basic view
-
After specifying the relevant query, click Search or press Enter.
TIP: To save the queries for future use, simply save the URL or bookmark it in your browser.
Expected result
Session metadata is displayed in columns that you can query for any parameter, or a combination of parameters. You can view the metadata in the search columns and also displayed as fields in the Overview, Details, and Timeline tabs.