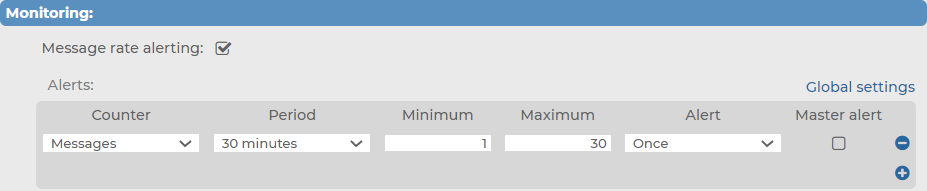
Under Log > Sources > <your-new-source> > Syslog > Monitoring, you can customize your monitoring settings for your Syslog type message source.
To customize your settings related to monitoring for your Syslog type message source
-
Navigate to Log > Sources > <your-new-source> > Syslog > Monitoring.
Log > Sources > <your-new-source> > Syslog > Monitoring.
Figure 116: Log > Sources > <your-new-source> > Syslog > Monitoring — Customizing your monitoring settings your own, customized Syslog type message source
-
(Optional) Enable Message rate alerting.
-
Select the basis of your alerts under Counter.
-
Select the frequency of alerts (in minutes) under Period.
-
Specify the amount of alerts you want to receive within the specified Period (ranging between the minimum and maximum numbers of your choice) under Minimum and Maximum.
-
Select the alerting frequency in the Alert field.
Once sends only one alert (and after the problem is fixed, a "Fixed" message).
Always sends an alert each time the result of the measurement falls outside the preset range.
-
(Optional) To set the configured alert settings as your default, enable Master alert.
-
(Optional) To leave the Log > Sources > <your-new-source> > SQL > Monitoring page and customize Message rate alerting statistics settings that apply to the entire syslog-ng Store Box (SSB) appliance, clicking Global settings takes you to Log > Options > Message rate alerting statistics.
For more information about the configurable settings you can customize under Log > Options > Message rate alerting statistics, see Configuring message rate alerting.
NOTE: You can configure multiple alerts under Monitoring and pick the alert of your choice as your Master alert. To add a new alert under Message rate alerting, click  . To delete a redundant alert, click
  .
.
-
To configure Message rate alerting for the source, see Configuring message rate alerting.
-
Set the character Encoding option of the incoming messages if needed.
-
Click  .
.
-
(Optional) If you want to receive messages using the ALTP or ALTP TLS protocol, make sure that you have configured your syslog-ng PE clients to transfer the messages to SSB using ALTP or ALTP TPS protocol. For details, see Advanced Log Transfer Protocol.
Under Log > Sources > <your-new-source> > Syslog > Other options, you can customize your encoding preferences for your Syslog type message source.
To customize your encoding preferences for your Syslog type message source
-
Navigate to Log > Sources > <your-new-source> > Syslog > Other options.
Figure 117: Log > Sources > <your-new-source> > Syslog > Other options — customizing your encoding preferences for your Syslog type message source

-
Select the Encoding type you want the Syslog source type to use.
When configuring your own, customized message sources in syslog-ng Store Box (SSB), you can configure two source types: Syslog, or SQL.
For more information about configuring a Syslog source type in your own, customized message source, see Configuring your own, customized Syslog type message source.
There are many applications that natively store their log messages in SQL databases. The SSB appliance can pull messages from SQL database tables in real-time, similarly to receiving messages over the network.
Figure 118: Log > Sources > <your-new-source> — SQL source type in your own, customized message source

Prerequisites for configuring your own, customized SQL type message source
Currently, configuring your own, customized SQL type message source in SSB has the following prerequisites:
-
The Address for the SQL type message source (that is, IP address of the remote database server to collect messages from).
-
The Port of the database server that the SQL type message source will connect to.
-
The Username of the database user.
-
The Password of the database user.
-
A previously configured SQL database that you can specify the SQL type message source to connect to, by entering the database name into Database name.
Limitations to configuring your own, customized SQL type message source
When configuring your message sources, consider that currently, configuring your own, customized SQL type message source in SSB has the following limitations:
Configuration options for your own, customized SQL type message source
While configuring your own, customized SQL type message source, you can customize the following:
-
Configuring and testing the Database connection of your SQL source.
-
Customizing your fetch queries and message fetching settings under Fetching messages.
-
Customizing your fetch history and test message fetching under Fetch history.
-
Customizing your Fetching frequency.
-
Customizing your Monitoring options.
For further details on the configuration options, see the following subsections:
Topics:
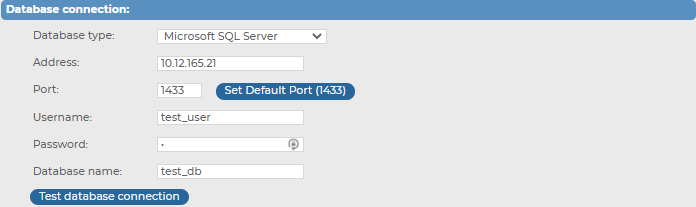
The following section describes how to setup the SQL database connection of your SQL type message source, and how the connection is tested.
To setup and test the SQL database connection in your SQL type message source
-
Navigate to Log > Sources > <your-new-source> SQL > Database connection.
Figure 119: Log > Sources > <your-new-source> > SQL > Database connection — Setting up and testing the SQL database connection for your SQL type message source
-
Select the Database type to collect log messages from.
-
Enter the name or the IP address of the remote database server to collect messages from.
-
Enter the port of the database server to connect to. To use the default port of the database, click Set Default Port.
NOTE: The default port depends on the database type, but you can configure it according to your preferences.
-
Enter the Username and the Password of the database user.
NOTE: The syslog-ng Store Box (SSB) appliance accepts passwords that are not longer than 150 characters. The following special characters can be used: !"#$%&'()*+,-./:;<=>?@[]^-`{|}
-
Enter the Database name to connect to.
-
Click Test database connection. SSB reads the tables from the database.
NOTE: The syslog-ng Store Box (SSB) appliance can only read table names that contain numbers, uppercase and lowercase characters, hyphen (-), underscore (_), hashtag (#), at sign (@), or the dollar sign ($). Tables with names that contain other characters, including full stop (.), cannot be monitored.
