This section describes the tools to detect networking problems, and also how to collect core files and view the system logs of syslog-ng Store Box (SSB).
Topics:
SSB T4 and SSB T10
To find syslog-ng Store Box (SSB) appliance T4 and SSB T10 in the server room, you can use IPMI to control the front panel and back panel identify lights.
-
On SSB T4 and SSB T10, navigate to Basic Settings > System > Hardware information > Blink system identification lights.
-
To blink the blue LEDs on the front and back of the SSB appliance, click On.
NOTE: SSB T1 does not support identify lights.
Alternatively, use the command line as follows:
-
To start the blinking of the blue LEDs on the front and back of the SSB appliance, enter:
ipmitool chassis identify force
-
To stop the blinking of the blue LEDs on the front and back of the SSB appliance, enter:
ipmitool chassis identify 0
syslog-ng Store Box Appliance 3000 and syslog-ng Store Box Appliance 3500
To locate syslog-ng Store Box Appliance 3000 and syslog-ng Store Box Appliance 3500, look for an appliance that has a white front panel with a light blue One Identity logo on it.
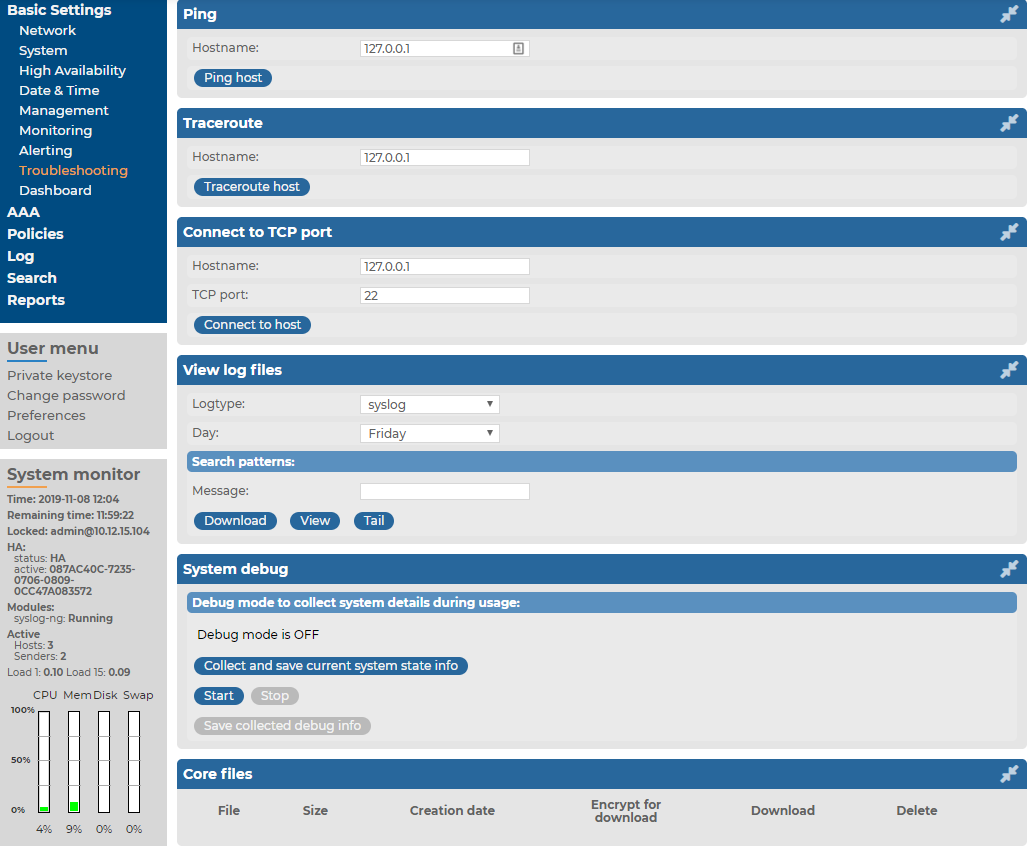
The Troubleshooting menu provides a number of diagnostic commands to resolve networking issues. Logfiles of syslog-ng Store Box(SSB) can also be displayed here — for details, see Viewing logs on SSB.
Figure 222: Basic Settings > Troubleshooting > System debug — Network troubleshooting with SSB

The following commands are available:
-
ping: Sends a simple message to the specified host to test network connectivity.
-
traceroute: Sends a simple message from SSB to the specified host and displays all hosts on the path of the message. It is used to trace the path the message travels between the hosts.
-
connect: Attempts to connect the specified host using the specified port. It is used to test the availability or status of an application on the target host.
To execute one of the commands above
-
Navigate to Basic Settings > Troubleshooting.
-
Enter the IP address or the hostname of the target host into the Hostname field of the respective command. For the Connect command, enter the target port into the Port field.
-
Click the respective action button to execute the command.
-
Check the results in the popup window. Log files are displayed in a separate browser window.
syslog-ng Store Box (SSB) automatically generates core files if an important software component (for example, syslog-ng, or the indexer) of the system crashes for some reason. These core files can be of great help to the One Identity Support Team to identify problems. To display a list of alerts, navigate to Search > Log Alerts.
To list and download the generated core files, navigate to Basic Settings > Troubleshooting > Core files.
By default, core files are deleted after 14 days. To change the deletion timeframe, navigate to Basic Settings > Management > Core files.

