
Health Monitoring
Health checking is an important feature of VDS and you will need to enable it if you make use of VDS's load-balancing or fail-over options for your server groups. In other words, any solution that makes use of more than one server within a DataSource, should really have Health Monitoring enabled.
The principle behind the health checking component is simple. VDS will periodically check each server in the group by sending simple requests to it. If VDS notices that a server loses availability, or comes online again, the server status will change accordingly. VDS makes use of this state information to decide where to send each next request.
How Health Monitoring works
Health Monitoring works by periodically triggering a monitor cycle in VDS. This is done automatically by the BE Manager supervisor scripts that are installed within your configuration by the DSGUI application, and the cycle is run every few seconds. The parameter that controls how often this happens can be set in the Health Monitoring Configuration Panel for each configuration of VDS.
This monitor cycles are basically three different monitors each of them in a different cycle:
Health Check
When VDS decides to start a Health Check monitor cycle, a health check on all servers is initiated. This is done by sending a number of requests to each server. The health check is run against each server independently and in parallel to all of the other running health checks. In other words, VDS does not wait for a health check to complete on one server before health-checking other servers.
The regular operation for a health check is:
-
Send request to server
-
Wait for response up to the timeout
-
Repeat this process a configured amount of times
If at the end of this health check the server has not responded to any of the requests, the server is considered to be down. If a server that was previously considered down responds to any of the requests during the health check, the server's state is changed to up. Note that as the health check consists of several requests to the server, only a single response to any of these queries during one health check cycle is required to set the status of the server to up. All requests must fail for a server to change to down status.
The reason for sending several requests within one health-check iteration is that it is possible that a server is just slow to respond, or that there is a very transitory failure in the network that may cause a server to appear down for a small amount of time, but does not necessarily imply the complete failure of a server.
Pool Monitoring
When VDS decides to start a Pool monitor cycle, for any of the pools created each minimum number of connections is established and authenticated (if the Server is UP).
This monitor also checks at each cycle the number of connections opened against each DataSource and re-balance the connections to get the expected numbers (closes one if there are too many opened or opens one if there are too little opened).
Keep Alive
When VDS decides to start a Keep Alive monitor cycle, a request is sent to any of the connections of any of the pools selected for the keep alive procedure so they are not considered idle and can avoid Server timeout.
Health Monitoring is currently available for LDAP and HTTP DataSources. The Health Monitoring configuration is separated into two tabs one for Health Check and another one for Pool Monitoring / Keep Alive.
The Health Check Configuration Panel
VDS allows you to configure several parameters related to LDAP Health Monitoring. These fall into the following categories:
-
Global health checking service settings
-
Operational parameters for each health checking instance
Fig-28: The LDAP Health Monitor Configuration Panel
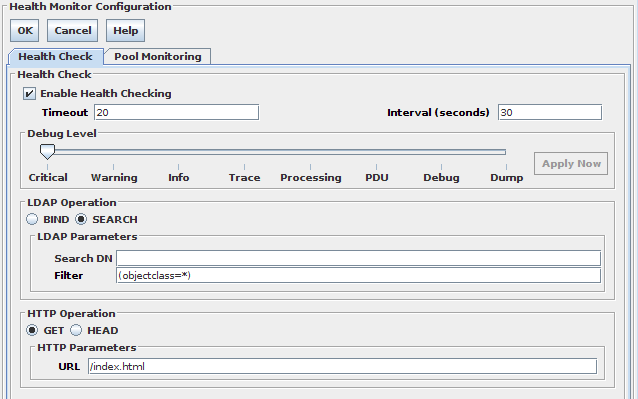
Global health checking service settings
The following parameters can be configured in this section:
- Enable Health Checking
-
This controls the presence of the health checking service within an instance of VDS. Health checking should only be disabled for testing purposes or for very simple backend configurations that do not use any DataSource facilities (like connection pooling, fail-over or load balancing algorithms, etc.).
- Interval (seconds)
-
Number of seconds of delay between the end of a health check cycle and the beginning of the next.
Configuring operational parameters for each health checking instance
The next section in this configuration panel includes debugging parameters to allow you to troubleshoot health checking operations. Debugging should generally be disabled on production servers.
- Debug Level
-
If you want to turn on debugging of health-checking, you may specify the debug level here by shifting the slider to determine the verbosity of the logging output. The level of detail provided is increased by moving the slider from left to right. Please also see the section on Debug Logs for live instances.
The next section in the configuration panel contains the following operational parameters, which relate to the settings for each health check instance:
- Operation for Health-Check
-
Can be BIND or SEARCH. This determines the type of operation that is sent to each back-end DataSource for health checking unless otherwise stated in each DataSource's Health Check configuration tab. See DataSource Health Check .
- Timeout
-
The maximum time in seconds that VDS will wait for one health check request to be answered. Once this timeout has been exceeded and no response has been received from the back-end, the operation is considered to have failed. By default this is 20.
The LDAP section in the configuration panel will change depending on whether you have selected BIND or SEARCH as the health check operation that will be used. If you have chosen to use BIND as the type of operation to be used, you will be required to provide authorization information for the BIND request to take place. If you have chosen to use SEARCH as the type of operation to be used, you will be required to provide the Search DN and Filter to use to perform the search request. These settings can be overridden for individual DataSources by specifying these parameters within each DataSource's Health Check configuration tab. See DataSource Health Check for more information.
- For BIND requests
-
Specify the Bind DN and the password.
- For SEARCH requests
-
Specify the Search DN and the Filter. By default, each SEARCH request is anonymous and of scope 0 (Base).
The HTTP section in the configuration panel requires that you provide the URL that should be used to query the HTTP server. This URL will be queried using the Operation type that is specified for the health monitor. As long as the Health Monitoring process receives a response code of 200, the server will be considered to be 'up'.
The Pool Monitor Configuration Panel
The Pool Monitor panel just have the interval cycle which you want to use for the pool Monitoring and also the Keep Alive Section+.
The Keep Alive section has a check box which needs to be enabled to have the keep alive working. Also has its own interval cycle and two fields for the options to be used by the request to be sent, one for specifying the Search Base and another one for the filter.
Note that the operation is not going to be sent to already closed Bes.
The Administration Port
The administration port is an optional feature of VDS that provides an alternative port and infrastructure capable of accepting LDAP requests that will provide an administrator with the ability to change the behavior of a running instance of VDS. In order to do this, the administrator will need to connect to the port using a set of predefined credentials.
Currently, the administration port is used to perform a graceful shutdown of a running instance of VDS, as well as to provide the facility to display some basic running statistics. The administration port is also capable of accepting requests to change the log-levels on the fly. Future releases of VDS can have new functionality provided by this port.
Graceful shutdown
Graceful shutdown is a process used for sending a shutdown signal to a running instance of VDS, that will try to resolve all pending requests before killing the running process.
The graceful shutdown process is triggered by sending an LDAP_ADD request with the credentials configured in the admin port to a virtual entry with cn=gracefulshutdown as DN. The ADD operation can have an additional attribute called shutdowntime with a value that will control the maximum number of seconds that the running instance will wait for all requests to be processed before terminating. If the shutdowntime attribute is not included in the ADD request, the predefined configuration value will be used. If a shutdowntime value has not been defined in the configuration and this attribute has not been passed to the running VDS in the ADD request, a default value of 240 seconds (4 minutes) will be used.
When a graceful shutdown request is received by a running instance of VDS, all of the listeners attached to that instance are closed, so that no new requests are accepted by it. The graceful shutdown process then starts checking periodically for the number of pending requests that the process has not yet sent a response to. It will do this until the number of pending responses reaches 0, or until the maximum number of seconds defined by the shutdowntime variable have passed. At this point the VDS process is terminated.
The graceful shutdown can be initiated manually by sending an LDAP request as explained above, but as an alternative, DSGUI is also capable of triggering a graceful shutdown process using the Menu as explained in ( The Toolbar )
As the administration port provides a facility to remotely terminate the service provided by an instance of VDS, it is recommended that for production environments you change the credentials used to access this facility. This can be done by editing the Bind DN and Password fields in the Administration Port panel for the configuration, as described below.
Statistics
The administration port offers a simple method for getting some basic statistics from a running instance of VDS. These statistics can be viewed from within the DSGUI, or can be accessed directly using LDAP requests.
By sending an LDAP_SEARCH request, with the appropriate credentials, to the administration port using cn=stats as base with the scope set to 'base' (filter, attribute lists etc. are ignored) a collection of statistics will be returned as a single LDAP entry. The statistics are collected using the dsconfig_query_shuffler dsproxy API function (See Dell One Identity Virtual Directory Server Developer's Reference Manual for details), and offer the following fields:
- Active Listeners
-
Number of listeners accepting requests
- Open Frontends
-
Number of open clients to listener connections
- Open Backends
-
Number of connections opened between VDS and backend data repositories
- Backends with outstanding requests
-
Number of backend connections that are waiting for responses from data repositories
- Outstanding requests
-
Number of requests across the whole instance that are waiting for responses from Backends.
These statistics can also be viewed directly from within the DSGUI, by viewing the Administration Port configuration panel for the running instance of VDS. This offers a convenient way of viewing the statistics for a running instance by simply clicking on the "Statistics" button.
Note that it is possible to obtain additional statistical information through the Administration Port by making use of particular plugins, like the LDAP Statistics Generator (LDAPStats) plugin.
Controlling Log Levels for live instances
As of version 5 of VDS, it is possible to change the verbosity of log output while an instance is running. This is achieved by sending a MODIFY request to the administration port, which will update the log level in the global hash for the service that requires a change in log verbosity. In order for this facility to work, the administration port naturally needs to be enabled and running alongside the instance.
All log level settings for the various components that make up a configuration provide a 'slider' which allows you to set the verbosity of the logging output. Options range from 'Critical' on the left, through to 'Dump' on the right of the slider. Critical messages will always show in the logs, however the logging output for any component can be increased gradually by moving the slider toward the right.
On the right of each log-level slider is an 'Apply Now' button. This button will generally be greyed out. If the administration port is enabled and the instance is running, and you make a change to the log level for any component in the configuration, the 'Apply Now' button will become available. Clicking on this button will send a MODIFY request to the administration port to update the log level for that component within the configuration. The change to the configuration will be instantly affected on the running instance, allowing you to alter the debug level while an instance is running to improve your ability to debug any possible problems with a particular configuration.
The Administration Port configuration panel
The Administration Port configuration panel is used to set the parameters that control the administration port, and also to view statistical information directly.
Fig-29: The Administration Port Configuration Panel
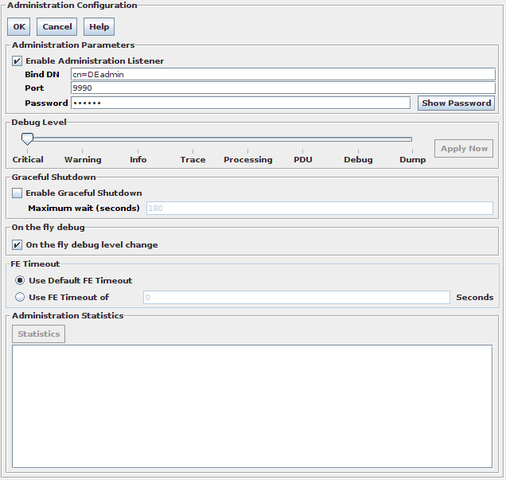
The following fields can be configured:
- Enable Administration Listener
-
This check box controls whether the instance of VDS will provide the Administration Port functionality at all.
- Bind DN
-
In this field, you are able to set the credentials to be used when connecting to the admin port to issue commands or get data.
- Port
-
This value is the TCP Port that you wish the Administration Port to be available on. It must not be in use by any other application.
- Password
-
Password to validate the admin port user credentials.
- Debug Level
-
If you want to enable debugging of admin port functionality, you may specify the debug level here by changing the position of the slider to increase log verbosity. Please also see the section on Debug Logs for live instances.
- Enable Graceful Shutdown
-
This setting determines whether the graceful shutdown functionality will be available on this instance of VDS.
- Maximum wait (seconds)
-
This is used to set the shutdowntime variable (explained in previous section) if a gracefulshutdown request does not specify a value.
- On-the-fly debug level change
-
This check box controls whether or not it is possible to change debug levels for configuration components while the instance is running. If enabled, changes to debug levels in DSGUI can be applied to a running instance directly through the admin port to effect an immediate change.
- FE Timeout
-
If "Use Default FE Timeout" is selected, this will cause the Administration port to make use of the Default FE Timeout options specified in the Global Parameters for the configuration. If these are disabled in the Global Parameters, no timeout will be applied. By selecting the "Use FE Timeout of" option, you are able to specify the period after which an idle frontend connection will be dropped, this is controlled by providing a value in the Seconds field.
- Statistics button
-
This button will trigger a statistic collection query to the running instance and will present the results in the text area beneath it.
INPUT
The Input section of a configuration defines how VDS will interact with the client applications that connect and then send requests to it. For this purpose, input channels are created in VDS. These input channels are called listeners.
Fig-30: VDS Input
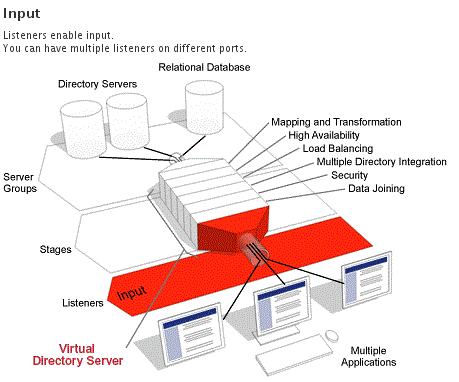
A listener is an entity that listens on a port and accepts connections, also called sessions. A listener is therefore the "front door" through which client requests arrive.
VDS supports multiple types of listeners based on various protocols. At least one listener needs to be active for VDS to be used by client applications. Multiple listeners, either using the same or different protocols, can be active as long as they are on different ports and/or IP addresses.
Listeners also define what kind of processing is performed on incoming requests. Once a Processing Stage has been defined in the Processing node of the configuration, it can be attached to a particular listener so that requests that come in on this port undergo some form of processing directly by VDS. Creating Processing Stages is discussed more thoroughly in the PROCESSING chapter.
For each listener, a default server group can be assigned to process requests if a processing stage script attached to the listener does not set a destination for these requests or simply to route traffic to a destination if no processing is to be performed on requests coming into the listener.
As an alternative to providing a default server group, a Virtual Tree can be constructed and attached to a listener. This Virtual Tree will be presented to any client that connects to the listener. The Virtual Tree can contain virtual mount points, onto which a DN in a defined DataSource can be mounted or attached. This provides the possibility of constructing a single Virtual Tree that is comprised of nodes from a variety of backend DataSources, to present a single unified view of the data. This facility is discussed at length in this chapter, particularly in the section How To Use Virtual Trees .
Creating a Listener
In order for your VDS configuration to do anything useful, you will need to create at least one listener. To do this, select the node called Input in the tree navigator and do either one of the following:
-
Click on the New Listener button in the configuration panel
-
Right-click on the Input node in the tree Navigator
-
Select New Listener from the Entry menu
You will then be asked for the name of your new listener, and a listener node will be created in the tree. Once you have done this, select your new listener node in the Navigator to configure it.