To obtain an overview of the system configuration
-
Start the Designer or the Manager and select the Help > Info menu item.
The System information tab provides an overview of your current system administration and the installed modules with their versions.
IMPORTANT: You will need to provide this information if you contact the Support Team.
NOTE: If you have enabled vendor notification, this report is sent once a month to One Identity.
During a schema installation or schema update using the Configuration Wizard, the migration date and migration version are recorded in the database transport history.
When you import a transport package with the Database Transporter, the import date and description, the database version, and the transport package name are recorded in the transport history of the target database.
To display transport history
The One Identity Manager tools offer various possible ways to display error messages.
Detailed information about this topic
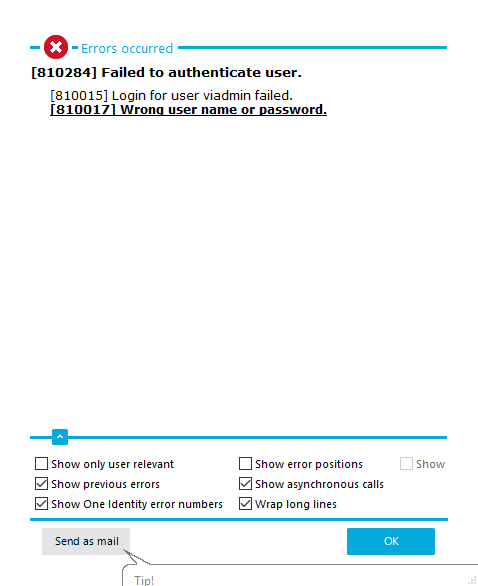
Error messages for the One Identity Manager tools are shown in a separate window. In addition, a more detailed description of the error is displayed.
Figure 3: Error message window
-
To send the messages, click on the Send as mail button.
This creates a new email message in the default mail program and copies over the error text.
-
To copy the messages to the clipboard, open the context menu for the Send as mail button and click on Copy to clipboard.
-
To record the steps taken that gave the error, start the Windows Steps Recorder.
You can now start recording the individual steps. Detailed information about recording the steps taken to reproduce a problem using the Windows Steps Recorder can be found in the Microsoft documentation.
Configure the amount of information to be displayed using the options in the error message window.
To change options
Table 8: Options for displaying error messages
|
Show previous errors |
Specifies whether all previous errors that lead to the current error, should also be shown. |
|
Show One Identity error numbers |
Specifies whether internal error numbers are shown. |
|
Show error positions |
Specifies whether error position is also shown in the program code. |
|
Wrap long lines |
Specifies whether long error messages are wrapped. |
|
Show only user relevant |
Specifies whether all error messages are to be displayed or only those error messages that are classified as user relevant. |
|
Show asynchronous calls |
Specifies whether error messages in asynchronous method calls are shown. |
|
Show crash report |
Specifies whether error messages from the crash recorder are shown. |
Related topics
A program's error log, as in the Manager for example, displays all the messages, such as error messages and warnings, that have occurred since the program started. The error log is reinitialized when the program is restarted.
NOTE: In the Manager, the  icon in the program’s status bar indicates new messages in the error log. Double-click the icon to open the error log.
To display items from the Manager error log
-
In the Manager, select the View > Error log menu item.
-
Enable the  view in the error log toolbar.
You can configure how the messages are displayed in the error log. To do this, switch the error log to advanced mode by clicking  on the right of the column headers. Here you have the possibility to debug individual actions.
TIP: You can apply different filters to limit the information being displayed. Click the arrow in the column header and select a filter. The  icon in the log toolbar shows whether a filter is active.
Figure 4: Simple error log (above) and advanced error log (below)
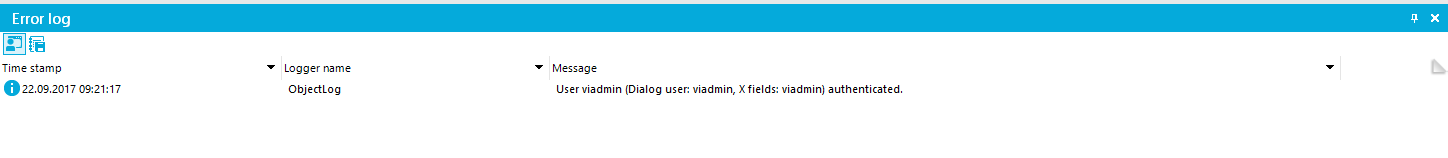
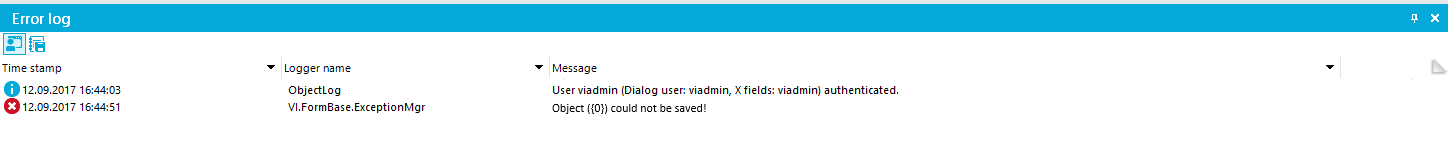
Table 9: Meaning of icons in the log
|

|
Logs all critical error messages. (Info level Fatal) |
|

|
Logs all information. (Info level Info) |
|

|
Logs all warnings. (Info level Warning) |
|
|
Logs all error messages. (Info level Error) |
|

|
Logs debugger output. This setting should only be used for testing. (Info level Debug) |
|

|
Logs highly detailed information. This setting should only be used for analysis purposes. The log file quickly becomes large and cumbersome. (Info level Trace) |
|

|
Adds a custom filter condition. |
|

|
Deletes filter condition. |
|

|
Searches for term. |
|

|
Searches next term. |
|

|
Marks all messages with a specific term. |
|
Buffer size |
Sets the message buffer size. The buffer's level is displayed next to the field. |
|

|
Deletes the buffer contents. |
|

|
Stops logging. |
|

|
Starts logging. |
|

|
Saves log to file. |
|

|
Specifies which column are displayed in the error log. |
|

|
Copies selected messages to the clipboard. |
|

|
Opens the error log with a text editor. |
The following information is displayed about a message. The range of information depends on the severity level of a message.
Table 10: Information about a message
| Severity code |
Level of information supplied for the message. |
| Timestamp |
Time and date of the log entry. |
| Logger name |
One Identity Manager component from which the message was sent. |
| Message |
Logged message. |
| Error Message |
Detailed error message. |
| Data |
Additional data about the message. |
| Sequence ID |
Number of the line in the error log. |
| Stack trace |
Complete stack trace for the error message. |
| Session ID |
Session identification number.
NOTE: If there is a filter set on the session ID, only the messages for this session are displayed, for example, loading collections and single objects. If the filter is not set, actions outside of the connection, such as loading of table definitions or configuration parameters, are also displayed. |
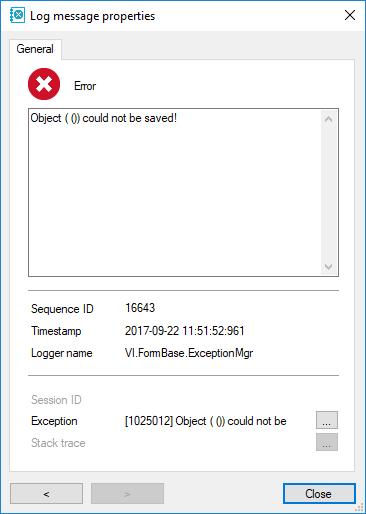
TIP: Double-click a message to display detailed information.
Figure 5: Detailed information about a message
Related topics

 button and enable or disable the options you want.