立即与支持人员聊天
与支持团队交流

One Identity Safeguard for Privileged Sessions 7.1.1 - Administration Guide

Preface Introduction The concepts of One Identity Safeguard for Privileged Sessions (SPS)
The philosophy of One Identity Safeguard for Privileged Sessions (SPS) Policies Credential Stores Plugin framework Indexing Supported protocols and client applications Modes of operation Connecting to a server through One Identity Safeguard for Privileged Sessions (SPS) Archive and backup concepts Maximizing the scope of auditing IPv6 in One Identity Safeguard for Privileged Sessions (SPS) SSH host keys Authenticating clients using public-key authentication in SSH The gateway authentication process Four-eyes authorization Network interfaces High Availability support in One Identity Safeguard for Privileged Sessions (SPS) Versions and releases of One Identity Safeguard for Privileged Sessions (SPS) Accessing and configuring One Identity Safeguard for Privileged Sessions (SPS)
Cloud deployment considerations The Welcome Wizard and the first login Basic settings
Supported web browsers The structure of the web interface Network settings Configuring date and time System logging, SNMP and e-mail alerts Configuring system monitoring on SPS Data and configuration backups Archiving Cleaning up audit data Using plugins Forwarding data to third-party systems Starling integration
User management and access control
Login settings Managing One Identity Safeguard for Privileged Sessions (SPS) users locally Setting password policies for local users Managing local user groups Managing One Identity Safeguard for Privileged Sessions (SPS) users from an LDAP database Authenticating users to a RADIUS server Authenticating users with X.509 certificates Authenticating users with SAML2 Managing user rights and usergroups Creating rules for restricting access to search audit data Displaying the privileges of users and user groups Listing and searching configuration changes
Managing One Identity Safeguard for Privileged Sessions (SPS)
Controlling One Identity Safeguard for Privileged Sessions (SPS): reboot, shutdown Managing One Identity Safeguard for Privileged Sessions (SPS) clusters Managing a High Availability One Identity Safeguard for Privileged Sessions (SPS) cluster Upgrading One Identity Safeguard for Privileged Sessions (SPS) Managing the One Identity Safeguard for Privileged Sessions (SPS) license Accessing the One Identity Safeguard for Privileged Sessions (SPS) console Sealed mode Out-of-band management of One Identity Safeguard for Privileged Sessions (SPS) Managing the certificates used on One Identity Safeguard for Privileged Sessions (SPS)
General connection settings HTTP-specific settings ICA-specific settings MSSQL-specific settings RDP-specific settings SSH-specific settings Using Sudo with SPS Telnet-specific settings VMware Horizon View connections VNC-specific settings Indexing audit trails Using the Search interface Advanced authentication and authorization techniques Reports The One Identity Safeguard for Privileged Sessions (SPS) REST API One Identity Safeguard for Privileged Sessions (SPS) scenarios Troubleshooting One Identity Safeguard for Privileged Sessions (SPS)
Network troubleshooting Gathering data about system problems Viewing logs on One Identity Safeguard for Privileged Sessions (SPS) Changing log verbosity level of One Identity Safeguard for Privileged Sessions (SPS) Collecting logs and system information for error reporting Collecting logs and system information of the boot process for error reporting Support hotfixes Status history and statistics Troubleshooting a One Identity Safeguard for Privileged Sessions (SPS) cluster Understanding One Identity Safeguard for Privileged Sessions (SPS) RAID status Restoring One Identity Safeguard for Privileged Sessions (SPS) configuration and data VNC is not working with TLS Configuring the IPMI from the BIOS after losing IPMI password Incomplete TSA response received Using UPN usernames in audited SSH connections
Using SPS with SPP Configuring external devices Using SCP with agent-forwarding Security checklist for configuring One Identity Safeguard for Privileged Sessions (SPS) Jumplists for in-product help Configuring SPS to use an LDAP backend Glossary

Interface

Figure 375: Basic Settings > Dashboard > Interface

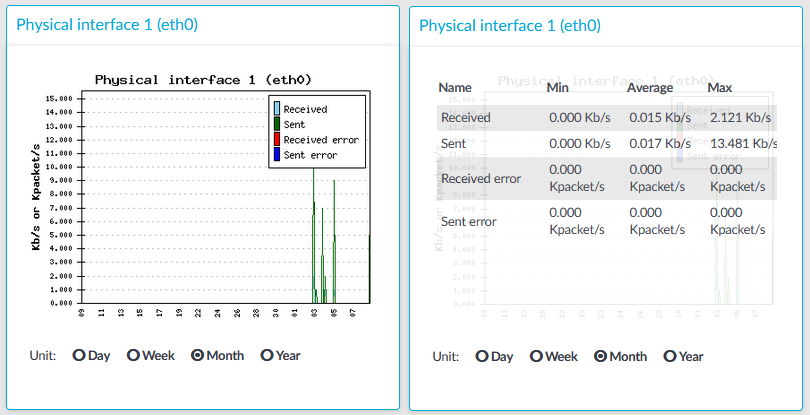
The Interface module on the Dashboard is based on data provided by the Linux kernel (/proc and /sys directories). The standard Munin plugins query this information from these locations and they are displayed on the GUI.

Statistics

The memory types displayed are the following:

  • Received: The network interface has received x Kilobytes per second.

  • Sent: The network interface has sent x Kilobytes per second.

  • Received error: The amount of errors, packet drops, and collisions on the network interface (in Kilopackets per second).

  • Sent error: The amount of errors, packet drops, and collisions on the network interface (in Kilopackets per second).

Load average

Figure 376: Basic Settings > Dashboard > Load average

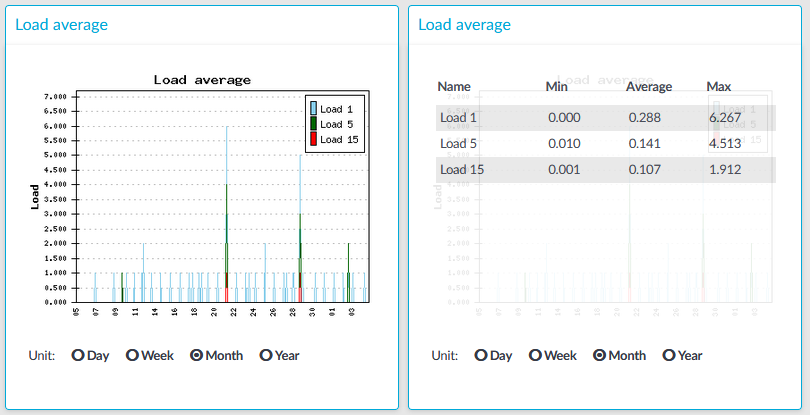
The Load average module on the Dashboard is based on data provided by the Linux kernel (/proc and /sys directories). The standard Munin plugins query this information from these locations and they are displayed on the GUI.

A measure of the amount of computational work that a computer system performs. The load average represents the average system load over a period of time. It conventionally appears in the form of three numbers which represent the system load during the last one-, five-, and fifteen-minute periods.

Statistics

The load average types displayed are the following:

  • Load 1: Average load in 1 minute.

  • Load 5: Average load in 5 minute.

  • Load 15: Average load in 15 minute.

Number of processes

Figure 377: Basic Settings > Dashboard > Number of processes

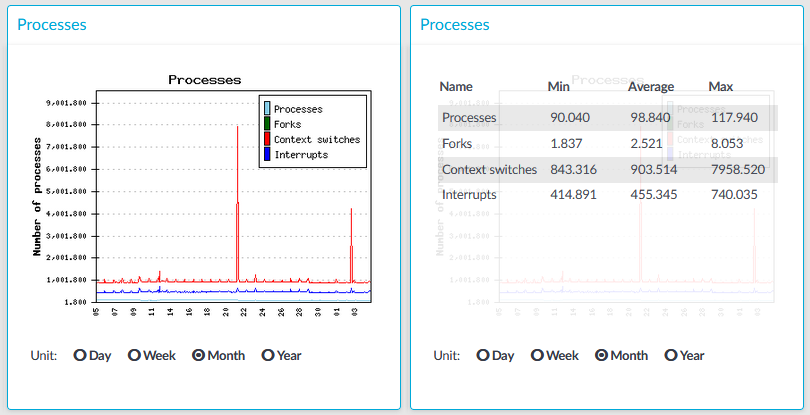
The Number of processes module on the Dashboard is based on the output of the ps command.

Statistics

The process types displayed are the following:

  • Processes: Number of running processes.

  • Forks: Number of forks (system calls). It is an operation where a process creates a copy of itself.

  • Context switches: Number of context switches. It is the switching of the CPU from one processor thread to another.

  • Interrupts: Number of interrupts.

Displaying custom connection statistics

The following describes how to display statistics of a specific connection policy.

To display statistics of a specific connection policy

  1. Navigate to Basic Settings > Dashboard > Connection statistics.

  2. To display the statistics of a connection policy, enter the name of the policy into the Connection.

  3. Select the time period to display from the Select resolution field.

  4. Click View graph.

相关文档

The document was helpful.

选择评级

I easily found the information I needed.

选择评级