The error message window in One Identity Manager tools
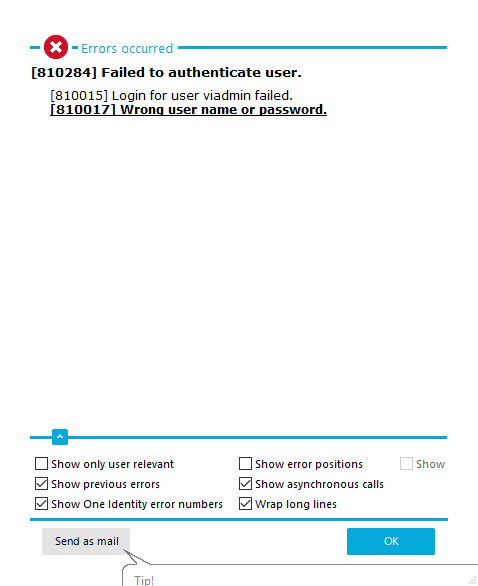
Error messages for the One Identity Manager tools are shown in a separate window. In addition, a more detailed description of the error is displayed.
Figure 3: Error message window
-
To send the messages, click on the Send as mail button.
This creates a new email message in the default mail program and copies over the error text.
-
To copy the messages to the clipboard, open the context menu for the Send as mail button and click on Copy to clipboard.
-
To record the steps taken that gave the error, start the Windows Steps Recorder.
You can now start recording the individual steps. Detailed information about recording the steps taken to reproduce a problem using the Windows Steps Recorder can be found in the Microsoft documentation.
Configure the amount of information to be displayed using the options in the error message window.
To change options
- Open the configuration view for the error messages window with the
 button and enable or disable the options you want.
Table 8: Options for displaying error messages
|
Show previous errors |
Specifies whether all previous errors that lead to the current error, should also be shown. |
|
Show One Identity error numbers |
Specifies whether internal error numbers are shown. |
|
Show error positions |
Specifies whether error position are also shown in the program code. |
|
Wrap long lines |
Specifies whether long error messages are wrapped. |
|
Show only user relevant |
Specifies whether all error messages are to be displayed or only those error messages that are classified as user-relevant. |
|
Show asynchronous calls |
Specifies whether error messages in asynchronous method calls are shown. |
|
Show crash report |
Specifies whether error messages from the crash recorder are shown. |
Related topics
Displaying error log messages
A program's error log, as in the Manager for example, collects all the messages, such as error messages and warnings, that have occurred since the program started. The error log is reinitialized when the program is restarted.
NOTE: In the Manager, the  icon in the program’s status bar indicates new messages in the error log. Double-click the icon to open the error log.
To display items from the Manager error log
- In the Manager, select the View | Error log menu item.
- Enable the
 view in the error log toolbar.
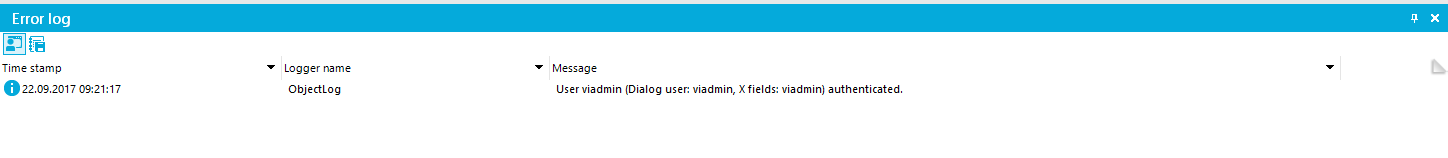
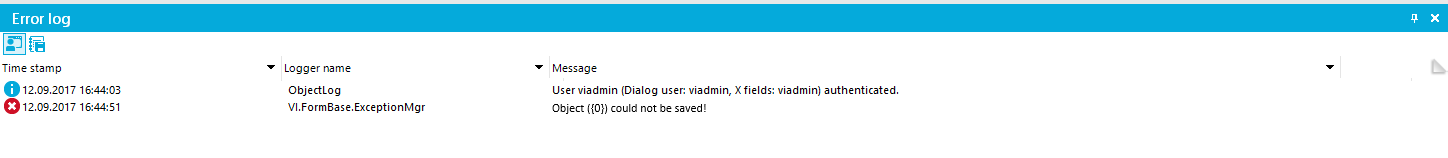
You can configure how the messages are displayed in the error log. To do this, switch the error log to advanced mode by clicking  on the right of the column headers. Here you have the possibility to debug individual actions.
TIP: You can apply different filters to limit the information being displayed. Click the arrow in the column header and select a filter. The  icon in the log toolbar shows whether a filter is active.
Figure 4: Simple error log (above) and advanced error log (below)
The following information is displayed about a message. The range of information depends on the severity level of a message.
Table 10: Information about a message
| Severity code |
Level of information supplied for the message. |
| Timestamp |
Time and date of the log entry. |
| Logger name |
One Identity Manager component from which the message was sent. |
| Message |
Logged message. |
| Error Message |
Detailed error message. |
| Data |
Additional data about the message. |
| Sequence ID |
Number of the line in the error log. |
| Stack trace |
Complete stack trace for the error message. |
| Session ID |
Session identification number.
NOTE: If there is a filter set on the session ID, only the messages for this session are displayed, for example, loading collections and single objects. If the filter is not set, actions outside of the connection, such as loading of table definitions or configuration parameters, are also displayed. |
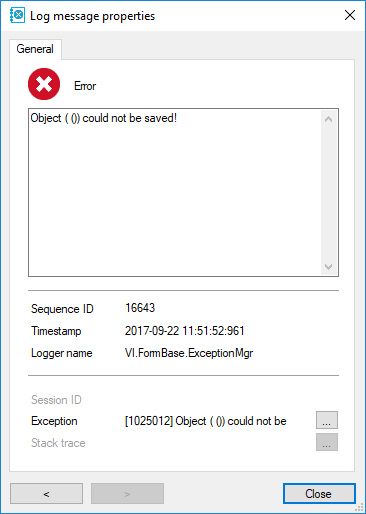
TIP: Double-click a message to display detailed information.
Figure 5: Detailed information about a message
Related topics
Displaying system journal messages
The system journal is used to store information, warning, and error messages from different components of One Identity Manager, for example, DBQueue Processor, Configuration Wizard, or One Identity Manager Service. Actions in the Job Queue Info program, such as reactivating process steps, are also recorded in the system journal.
To display system journal entries in the Manager
- In the Manager, select the View | Error log menu item.
- Enable the
 view in the error log toolbar.
To display system journal entries in the Job Queue Info
- In the Job Queue Info, select the View | System journal menu item.
TIP: You can apply different filters to limit the information being displayed. Click the arrow in the column header and select a filter. The icon in the log toolbar shows if a filter is active.
Table 11: Displaying messages in the system journal
 |
Information is written to the error log/system journal. |
 |
A warning has been written to the system journal. |
 |
A error has been written to the system journal. |
TIP: Double-click a message to display detailed information.
Figure 6: Detailed information about a message
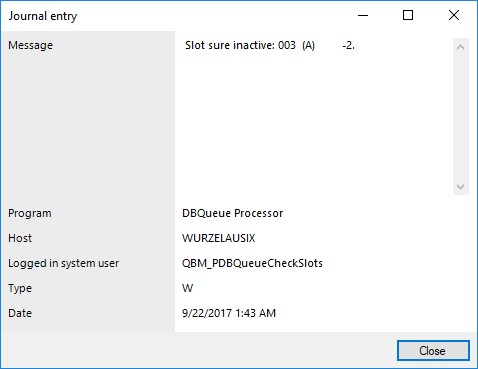
The following information is displayed about a message. The range of information depends on the type of message.
Table 12: Information about a message
| Message |
Logged message. |
| Program |
One Identity Manager component from which the message was sent. |
| Host |
Computer from which the action was started. |
| Logged in system user |
System user that triggered the action. |
| Type |
Type of message. (W= Warning, I = Info, E = Error, T = Trace) |
| Date |
Time and date of the log entry. |
Related topics
Displaying the One Identity Manager Service log file
You can use a browser front-end to display the One Identity Manager Service log file.
You call up the log file with the appropriate URL:
http://<server name>:<port number>
The default value is port 1880.
To open the One Identity Manager Service log file in the Job Queue Info
- Start the Job Queue Info program.
- In the Server state view, select the Job server and select the Open in browser context menu item.
The One Identity Manager Service HTTP server for the Job server is queried and the various One Identity Manager Service services are displayed.
Figure 7: The One Identity Manager Service log file
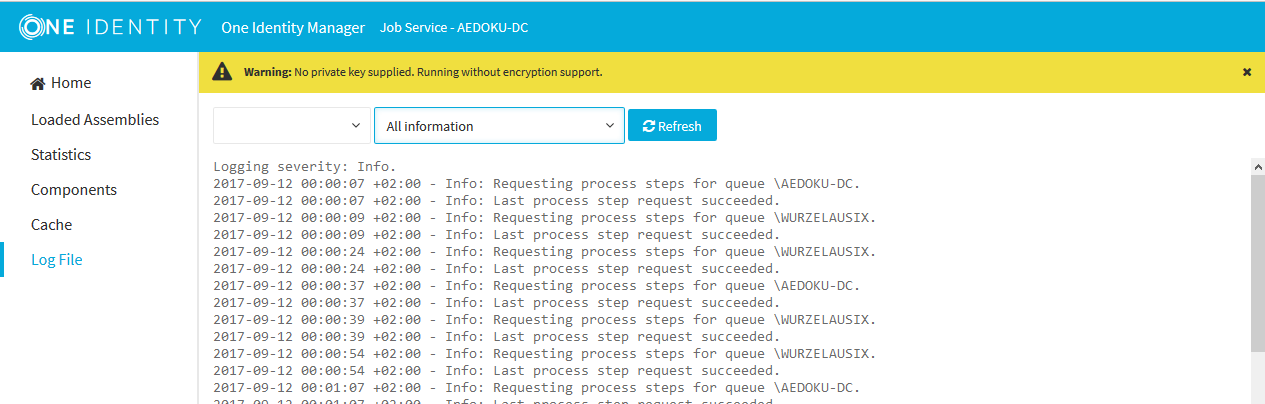
The messages to be displayed on the web page can be filtered interactively. There is a menu on the website for this. Only text contained in the log file can be displayed in this case. For example, if the message type is Warning, messages with the Info message type cannot also be displayed if the relevant filter is selected.
The log output is color-coded to make it easier to identify.
Table 13: Log file color code
| Green |
Processing successful |
| Yellow |
Warnings occurred during processing |
| Red |
Fatal errors occurred during processing |
NOTE: If you want to retain the color information to send by email, you need to save the complete web page.
Related topics


