The Manager‘s info system provides data about the health of the system in the form of diagrams.
-
Topic-specific statistics and cross-functional statistics are displayed on the Manager home page.
-
Within each category, topic-specific statistics are displayed under Info system.
-
Topic-specific statistics for all categories are displayed in the My One Identity Manager category.
Statistics definitions form the basis of the info system. These are created centrally. For detailed information about creating statistics definitions, see the One Identity Manager Configuration Guide.
Every user can set which statistics they want to see and in which order. Use the settings to do this. The changes are saved to the user configuration so that the last setting used is shown when the program is restarted.
All the available statistics are grouped by topic in the settings. Each statistic has a title and a description.
To select statistics for display
-
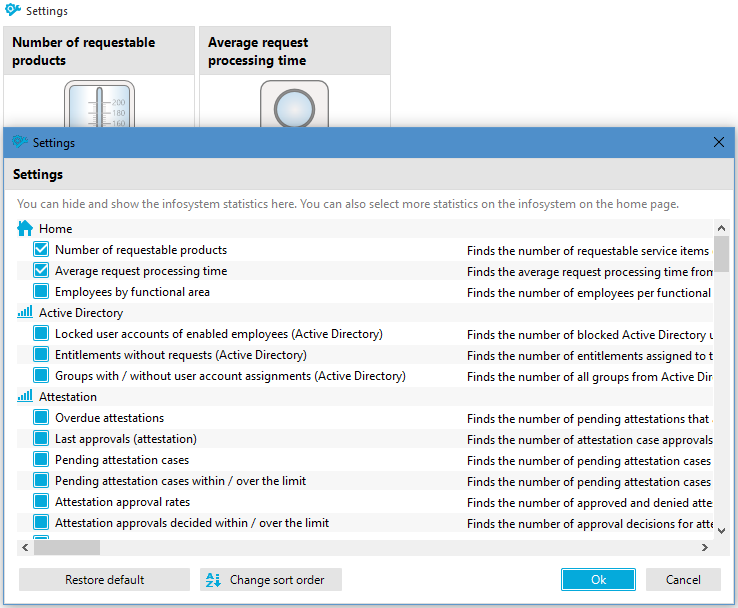
Show the statistics and click Settings.
-
Enable or disable statistics by clicking the button in front of the name of the statistics.
To restore the default setting, click Restore default.
-
Click OK.
Figure 2: Statistics settings
To change the order in which statistics are displayed:
-
Display the statistics and select Settings.
-
Click Change sort order.
-
Select the statistic that you wish to move. You can select multiple statistics using Shift + select or Ctrl + select.
-
Move the selected statistics with the arrow keys.
Table 7: Meaning of the buttons for changing the sort order.
|

|
Moves the selected statistics up. |
|

|
Moves the selected statistics down. |
-
To restore the default setting, click Restore default.
-
Click OK.
- OR -
If you wish to make more changes, go back to the Assignment view.
Detailed information about this topic
There are several diagram types available for visualizing statistics.
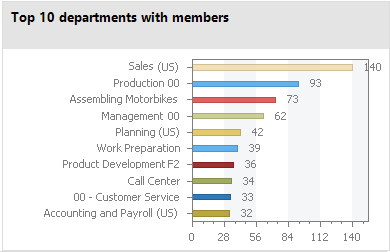
Bar chart
A bar chart can be used to visualize comparisons between measurements.
Figure 3: Bar chart example
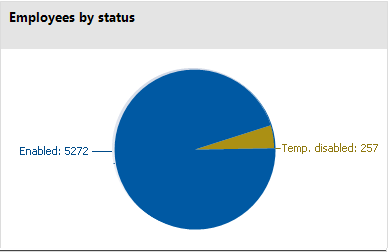
Pie chart
A pie chart can be used to visualize the measurements as a percentage of the base measurement.
Figure 4: Pie chart example
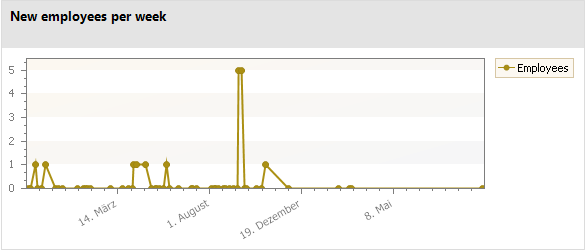
Line diagram
A line diagram can be used to visualize a data sequence over a specified time period. Click with the mouse on a point of measurement and a tooltip showing the measurement is displayed.
Figure 5: Line diagram example
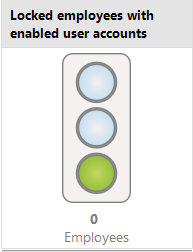
Traffic light
A traffic light diagram can be used to visualize the state of the system. The state is indicated by the color.
Table 8: Meaning of the colors
|
Green |
correct |
|
Yellow |
acceptable |
|
Red |
unacceptable |
Figure 6: Traffic light example
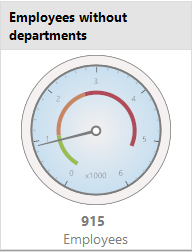
Tachometer
A tachometer diagram can be used to visualize the state of the system in more detail than in a traffic light diagram. The base measurement is also displayed. The state is indicated by the color.
Figure 7: Tachometer diagram example
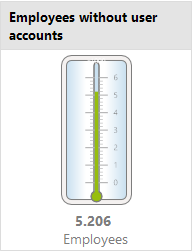
Thermometer
A thermometer diagram can be used to visualize the state of the system in more detail that in a traffic light diagram. The state is indicated by a color scale on the side of the diagram.
Figure 8: Thermometer diagram example
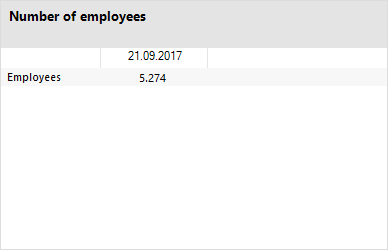
Table
Choose this diagram type to display the measurements or measurement trends over a certain timeframe in tabular format.
Figure 9: Table example
In One Identity Manager, you have the option of logging the change history of objects and their properties. Different methods can be used to track changes within One Identity Manager.
For detailed information about the process monitoring methods, see the One Identity Manager Configuration Guide. For more information about configuring process monitoring of IT Shop requests, see the One Identity Manager IT Shop Administration Guide.
In the Manager‘s process view, the system shows the process data from running processes and process steps, the process data for direct database actions, and the recorded data changes in graphical format.
Detailed information about this topic
-
The process view in the Manager is only available if the Common | ProcessState configuration parameter is enabled and a method for monitoring the process is configured.
-
The process view shows the process data only if the process data recording procedure is configured.
-
The log is only displayed in the process view if the method for logging changes to data is configured and the logged in user has at least viewing permissions for the Dialogwatch* , DialogProcess*, and QBMWatchOperationSummary tables.
-
To open the process view in the Manager, users need the Option to show process information (Common_ProcessView) program function.
For detailed information about configuring the process monitoring, see the One Identity Manager Configuration Guide.