Listing and searching configuration changes
One Identity Safeguard for Privileged Sessions (SPS) automatically tracks every change of its configuration. To display the history of changes, select Users & Access Control > Configuration History. The changes are displayed on a search interface. For more information on using and customizing this interface, see Using the internal search interface.
The following information is displayed about each modification:
Figure 102: Users & Access Control > Configuration History — Browsing configuration changes

-
Timestamp: The date of the modification.
-
Author: Username of the administrator who modified the configuration of SPS.
-
Page: The menu item that was modified.
-
Field name: The name of the field or option that was modified.
-
New value: The new value of the configuration parameter.
-
Message: The changelog or commit log that the administrator submitted. This field is available only if the Require commit log option is enabled (see below).
-
Old value: The old value of the configuration parameter.
-
Swap: Signs if the order of objects was modified on the page (for example the order of two policies in the list).
To request the administrators to write an explanation to every configuration change, navigate to Users & Access Control > Settings > Accounting settings and select the Require commit log option.
Using the internal search interface
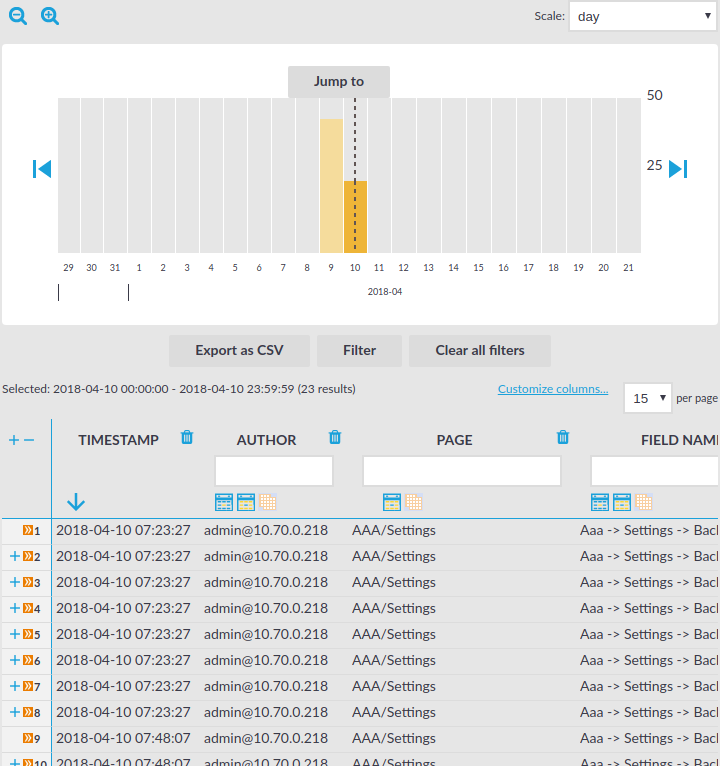
The internal search interface is for browsing and filtering the configuration changes and reports of One Identity Safeguard for Privileged Sessions (SPS).
Figure 103: Users & Access Control > Configuration History — The internal search interface

The bars display the number of results in the selected interval. Use the  and
and  icons to zoom, and the arrows to display the previous or the next intervals. To explicitly select a date, select Jump to and set the date in the calendar. You can change the length of the displayed interval with the Scale option.
Hovering the mouse above a bar displays the number of entries and the start and end date of the period that the bar represents. Click a bar to display the entries of that period in the table. Use Shift+Click to select multiple bars.
If data is too long to fit on one line, it is automatically wrapped and only the first line is displayed. To expand a row, click  . To shrink the row back to its original size, click
  . To expand/shrink all rows, click the respective button on the header of the table. The rows can also be expanded/shrunk by double clicking on the respective row.
Filtering
The tables can be filtered for any parameter, or a combination of parameters. To filter the list, enter the filter expression in the input field of the appropriate column, and pressEnter, or click on an entry in the table.
NOTE: When you use filters, the bars display the statistics of the filtered results.
Filtering displays also partial matches. For example, filtering the Author column on the Users & Access Control > Configuration History screen for adm displays all changes performed by users whose username contains the adm string.
You can use the  icon to perform an exact search, and the
  icon for inverse filtering ("does not include"). To clear filters from a column, click
  .
.
To restore the original table, click Clear all filters.
Exporting the results
To save the table of search results as a file, click Export as CSV. This saves the table as a text file containing comma-separated values. Note that if an error occurs when exporting the data, the exported CSV file will include a line (usually as the last line of the file) starting with a zero and the details of the problem, for example 0;description_of_the_error.
|

|
Caution:
Do not use Export as CSV to export large amounts of data, as exporting data can be very slow, especially if the system is under heavy load. |


 and
and  icons to zoom, and the arrows to display the previous or the next intervals. To explicitly select a date, select Jump to and set the date in the calendar. You can change the length of the displayed interval with the Scale option.
 . To shrink the row back to its original size, click
  . To expand/shrink all rows, click the respective button on the header of the table. The rows can also be expanded/shrunk by double clicking on the respective row.
 icon to perform an exact search, and the
  icon for inverse filtering ("does not include"). To clear filters from a column, click
  .
.