
This section describes how to set a custom certificate and a CA certificate for encrypting the transfer of log messages.
NOTE: If you do not upload a certificate to encrypt the TLS-communication (that is, the TLS certificate and TLS private key options are not set), syslog-ng Store Box(SSB) uses the certificate and CA certificate set for the web interface (set under Basic Settings > Management > SSL certificates) for this purpose as well.
One Identity recommends:
-
Using 2048-bit RSA keys (or stronger).
-
Using the SHA-256 hash algorithm (or stronger) when creating the public key fingerprint.
To set a custom certificate and a CA certificate for encrypting the transfer of log messages
-
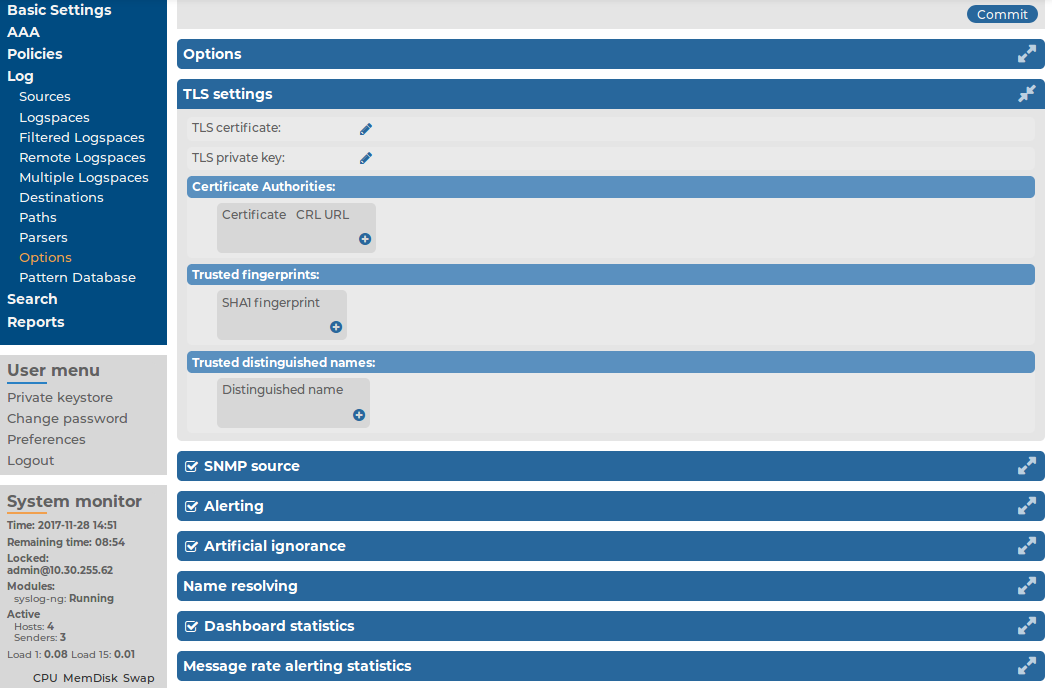
In your PKI system, generate and sign a certificate for SSB, then navigate to Log > Options > TLS settings.
-
Click the
icon in the TLS certificate field to upload the certificate.
Figure 184: Log > Options > TLS settings — Configuring TLS settings for syslog-ng
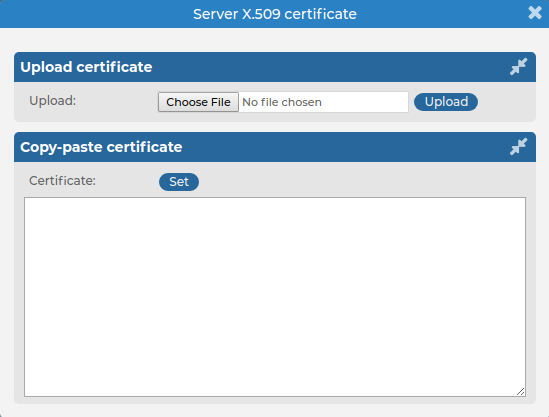
To upload a certificate from a file, click Browse in the Upload key section, select the certificate file, and click Upload. Alternatively, you can copy/paste the certificate into the Key field of the Copy-paste key section and click Upload.
You can choose to upload a single certificate or a certificate chain (that is, intermediate certificates and the end-entity certificate).
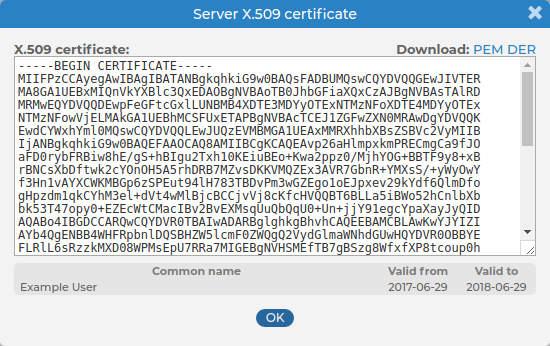
After uploading a certificate or certificate chain, you can review details by clicking the name of the certificate, and looking at the information displayed in the pop-up window that comes up.
Figure 185: Log > Options > TLS settings — X.509 certificate details
The pop-up window allows you to:
-
Download the certificate or certificate chain.
NOTE: Certificate chains can only be downloaded in PEM format.
-
View and copy the certificate or certificate chain.
-
Check the names and the hierarchy of certificates (if it is a certificate chain and there is more than one certificate present).
On hovering over a certificate name, the subject of the certificate is displayed, describing the entity certified.
-
Check the validity dates of the certificate or certificates making up the chain.
On hovering over a particular date, the exact time of validity is also displayed.
After uploading the certificate or certificate chain, the presence or absence of the string (chain) displayed after the name of the certificate will indicate whether the certificate is a certificate chain or a single certificate.
-
-
Click the
-
To set the certificate of the Certificate Authority (CA) used to verify the identity of the peers, click
in the Certificate Authorities field, then click
Figure 186: Log > Options > TLS settings > Certificate Authorities — Uploading certificates
To upload a certificate from a file, click Browse in the Upload key section, select the certificate file, and click Upload.
Alternatively, you can copy/paste the certificate into the Key field of the Copy-paste key section and click Upload.
Repeat this step to add more CA certificates if needed.
-
If the CA issues a Certificate Revocation List (CRL), enter its URL into the CRL URL field. SSB periodically downloads the list and refuses certificates that appear on the list.
NOTE: Note that only .pem format CRLs are accepted. CRLs that are in PKCS7 format (.crl) are not accepted.
-
If you want to accept connections only from hosts using certain certificates signed by the CA, click
Example: *, O=Example Inc, ST=Some-State, C=* accepts only certificates issued for the Example Inc organization in Some-State state.
-
If you want to accept connections only from hosts using certain certificates that have specific SHA-1 fingerprints, click
Example: 00:EF:ED:A4:CE:00:D1:14:A4:AB:43:00:EF:00:91:85:FF:89:28:8F, 0C:42:00:3E:B2:60:36:64:00:E2:83:F0:80:46:AD:00:A8:9D:00:15 adds these specific SHA-1 fingerprints: 00:EF:ED:A4:CE:00:D1:14:A4:AB:43:00:EF:00:91:85:FF:89:28:8F and 0C:42:00:3E:B2:60:36:64:00:E2:83:F0:80:46:AD:00:A8:9D:00:15.
NOTE: When using the trusted-keys() and trusted-dn() parameters at the same time, note the following:
-
If the fingerprint of the peer is listed in the trusted-keys() parameter and the DN of the peer is listed in the trusted-dn() parameter, then the certificate validation is performed.
-
If either the fingerprint of the peer is not listed in the trusted-keys() parameter or the DN of the peer is not listed in the trusted-dn() parameter, then the authentication of the peer fails and the connection is closed.
-
 icon, or see
 and
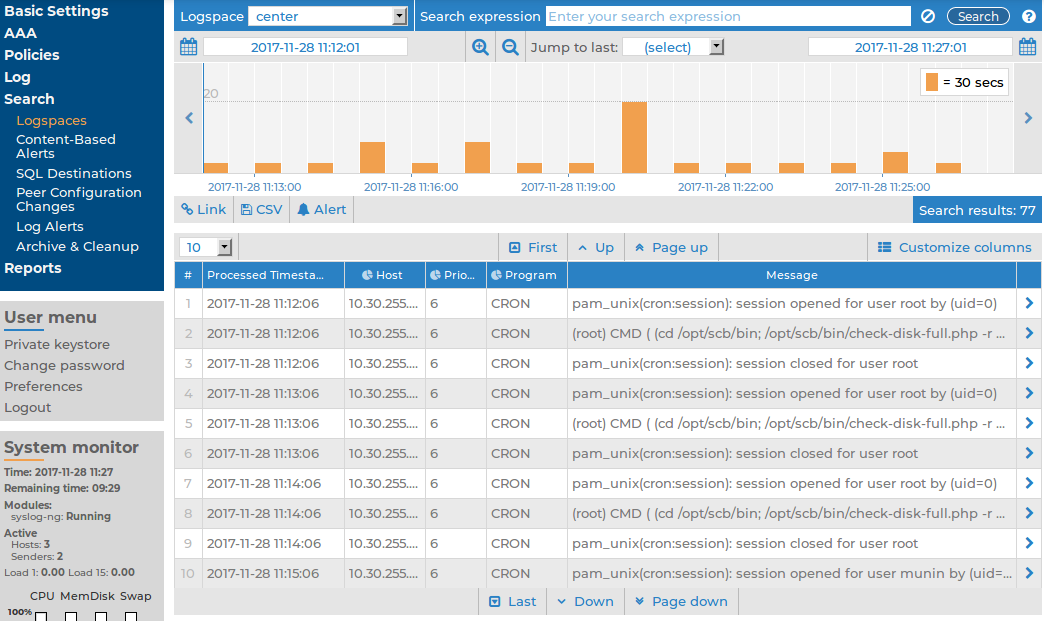
and  icons to zoom, and the arrows to display the previous or the next intervals. To change the timeframe, you can:
 , the Bookmark links panel is displayed:
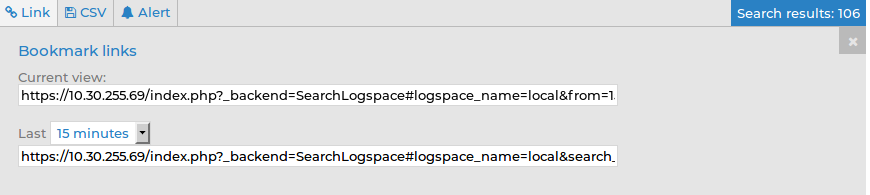
 , the CSV export panel is displayed:
 exports your search results into a CSV file. This saves the table as a text file containing comma-separated values. Note that if an error occurs when exporting the data, the exported CSV file will include a line (usually as the last line of the file) starting with a zero and the details of the problem, for example,
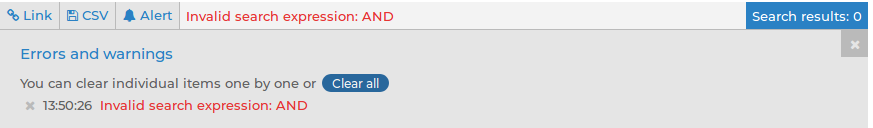
 next to the them, or clear all of them by clicking
  .
.
 . The complete log message is displayed:
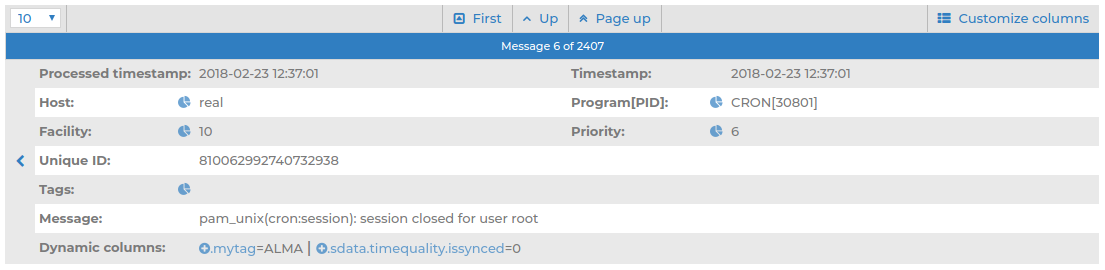
 icons to view the statistics of the selected category.
 .
.
 .
. .
.