Viewing authentication statistics
The Defender Management Portal provides a Dashboard that shows authentication statistics in graphical format. The Dashboard provides information about the number of successful and failed authentication attempts the users have performed, shows warning messages generated by the Defender Security Servers deployed in your environment, and displays the status of the Log Receiver Service.
To view authentication statistics on the Dashboard, the account with which you sign in to the Defender Management Portal must have an appropriate portal role assigned. For more information, see Portal roles.
To view authentication statistics on the Dashboard
- Sign in to the Defender Management Portal.
For more information, see Opening the portal.
- Click the Administer Defender option.
- In the left pane, click the Dashboard tab.
The Dashboard tab has the following elements:
- Log Receiver Service Shows the current status of the Defender Log Receiver Service. If the Defender Log Receiver Service is not running, the data on the Dashboard is not updated. If your portal role permits, you can also stop, restart, or configure the service.
- Warnings from Defender Security Servers Displays the most recent warning messages related to the Defender Security Servers in your environment. To view a complete list of warning messages, click More.
- Authentication requests by DSS, last hour Displays the number of authentication requests received during the last hour for each Defender Security Server running in your Defender environment. Move the cursor over each section of the pie chart to view the total number of authentication requests per Defender Security Server during the last hour and the percentage total.
- Authentications per hour, last 24 hours Displays the total number of successful and failed authentication requests received by all Defender Security Servers, per hour, in the last 24 hours.
Viewing Defender Security Server warnings and logs
You can use the Defender Management Portal to view warnings and logs generated by specific Defender Security Server deployed in your environment.
To view Defender Security Server warnings and logs, the account with which you sign in to the Defender Management Portal must have an appropriate portal role assigned. For more information, see Portal roles.
To view Defender Security Server warnings and logs
- Sign in to the Defender Management Portal.
For more information, see Opening the portal.
- Click the Administer Defender option.
- In the left pane, click the Activity tab
- In the right pane, use the following tabs:
- DSS Warnings Displays warning messages generated by the selected Defender Security Server. From the Select Defender Security Server list, select the server whose warnings you want to view.
- DSS Logs Displays the Defender Security Server logs in near real-time. From the Select Defender Security Server list, select the server whose logs you want to view.
Viewing token requests from users
You can view a list of token requests submitted by users through the Defender Self-Service Portal. This list provides such information as the name of user who requested a token, requested token type, and whether the token has been issued to the user.
To view token requests, the account with which you sign in to the Defender Management Portal must have an appropriate portal role assigned. For more information, see Portal roles.
To view token requests
- Sign in to the Defender Management Portal.
For more information, see Opening the portal.
- Click the Administer Defender option.
- In the left pane, click the Activity tab.
- In the right pane, click the Token Requests tab to open a list of token requests.
The list has the following columns:
- User Shows the name of the user who requested a token through the Defender Self-Service Portal.
- Token Shows the type of requested token.
- Request Type Shows the method that was used to deliver the token. Possible methods include immediate token delivery with no user verification, verification via an automated phone call or SMS, verification via e-mail.
- Request Date Shows the date and time when the request was made or completed.
- Request Completed Shows whether the token request was completed.
Using Defender reports
On the Defender Management Portal, you can generate and view a number of reports providing information about the security tokens, authentication requests from users, configuration of Defender Security Servers, installed Defender licenses, RADIUS payloads assigned to users, and more. After generating a report, you can print it out or save it in HTML or XML format.
To use Defender reports, the user account with which you sign in to the Defender Management Portal must have an appropriate portal role assigned. For more information, see Portal roles.
You can start using reports by clicking the Defender reports option on the home page of the portal:
The page that opens provides the following tabs you can use to configure, schedule, generate, and view Defender reports:
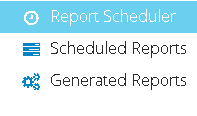
Report Scheduler Allows you to select a report, configure its settings, and schedule the report for generation.
Scheduled Reports Provides a list of all reports you have scheduled so far. The items in the list are also called scheduled report definitions. You can use this node to view the details of scheduled reports, immediately generate scheduled reports without waiting for next generation time, or selectively delete the scheduled report definitions you no longer need. Deleting a scheduled report definition stops the generation of the corresponding report but does not delete already generated reports located on the Generated Reports tab.
Generated Reports Provides a list of reports generated from the corresponding report definitions on the Scheduled Reports tab. You can use this node to view the generated reports and selectively delete the generated reports you no longer need. Deleting a generated report does not affect the underlying scheduled report definition located on the Scheduled Reports tab.
See also:
