One Identity Manager schema basics
The One Identity Manager‘s data model differentiates between user data and meta data.
The payload contains all the information required to maintaining data, such as information about employees, user accounts, groups, memberships, and operating data, approval workflows, attestation, recertification, and compliance rules. The user data is described by the application data model.
The meta data contains the description of the application data model and scripts for formatting roles and templates or conditional interactions. One Identity Manager’s entire system configuration, all the front-end control settings, and the queues for asynchronous processing of data and processes are also part of the metadata. The metadata is described by the system data model.
The application and system data model table definitions are stored in the DialogTable table. Column definitions for application and system data model tables are kept in the DialogColumn table. The tables relations and column relations are stored in the QBMRelation and DialogValidDynamicRef tables.
Related topics
Overview of the One Identity Manager schema
The data model is mapped and edited in the Designer in the One Identity Manager Schema category. This category displays the One Identity Manager default tables and the custom tables including their properties. It gives you an overview of customizations to the default configuration, the value templates and formatting rules of the database columns.
To display the schema overview
- In the Designer, select the One Identity Manager Schema category.
- Open the schema overview with the One Identity Manager Schema task.
TIP: When you select a table or column in the Designer, you can open the schema overview using the Show table <table name> in schema and Show column <column name> in schema tasks.
The schema overview has two modes for displaying the schema.
-
Displaying the data model
This mode gives you an overview of all tables including their columns and the table relations.
-
Displaying dependencies
This mode only displays those tables that have columns with dependencies due to value templates. Tables and columns without dependencies are not shown.
Tables and their columns are displayed using a special control element. The name of the database table is shown in the header of the control element. All other entries represent columns in the table. Each control element entry has a tooltip. The tooltip content depends on the display mode selected. The column entries are labeled with icons that mark particular properties of the columns depending on the display mode.
Figure 6: Control elements for displaying database tables and their columns
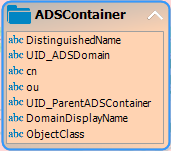
You can control the display of column entries with the Options | Show all columns and Options | Hide all columns menu items or the icons in the control element header. Use Options | Hide small tables menu item to only show the name of the table for tables with less than 20 columns.
To display tables and columns that are disabled by preprocessor conditions, use the Options | Show disabled columns menu item.
You can change the layout of the control elements in the schema overview with the mouse. Using the Options | Save table layout menu item the changes made to the schema layout are saved in the internal database and in the Designer's change log.
Relations between tables or columns are represented by connecting lines. You can control how these are displayed using the Options | Hide table relations menu item. If the menu item is disabled all the connectors are shown. If the menu item is enabled then none of the connectors are shown. If a control element is selected the connectors are highlighted anyway without regard to the menu setting.
Figure 7: Using connectors to illustrate relations
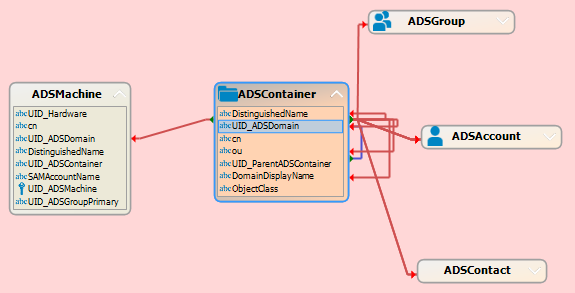
A connector points to column entries that are related to it. You can navigate between the connection points using the connector. When you select a connector the cursor changes to an arrow icon. Double-click on the connector to move the view to other end of the connector. The direction is indicated by the arrow icon. Movement is controlled with the Options | Animate movements menu item. When the cursor passes over a connector a tool tip, whose contents depends on the display mode, is shown.
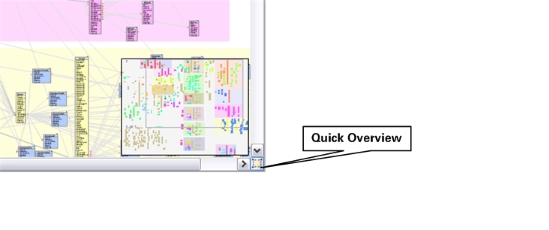
You can use the quick overview to navigate faster around the schema view. On the lower right edge of the schema overview there is a button which you use to open the quick overview. The area of the schema overview that is currently shown in the window is marked with a frame in the quick overview. Using the mouse you can move this frame around in the view. The corresponding area of the schema overview is then shown in the window.
Figure 8: Opening the quick overview
Related topics
Displaying data models in the Designer
This mode gives you an overview of all tables including their columns and the table relations.
To display the data model
-
In the Designer, select the One Identity Manager Schema category.
-
Open the schema overview with the One Identity Manager Schema task.
-
Select the Options | Data model menu item.
A table entry's tooltip contains the name of the table and the table's preprocessor conditions. A column entry's tooltip contains the name of the column, description, data type and the minimum and maximum length of the column.
A connector's tooltip shows the table relations. This tooltip contains the name of the tables that are related to it and the table relation properties. A single mouse click on the connector opens the table relation properties in the edit view.
Column entries are marked in the control with icons representing special properties, for example the column's .Net data type.
Table 12: Meaning of the icons
|

|
The column is a foreign key column (FK). |
|

|
The column is a primary key column (PK). |
|

|
The column has the string or text data type. |
|

|
The column has the binary data type. |
|

|
The column has the bool data type. |
|

|
The column has the int, byte, or short data type. |
|

|
The column has the double or decimal data type. |
|

|
The column has the date data type. |
Related topics
Displaying the column dependencies based on templates
This mode only displays those tables that have columns with dependencies due to value templates. Tables and columns without dependencies are not shown.
To display the column dependencies
- In the Designer, select the One Identity Manager Schema category.
- Open the schema overview with the One Identity Manager Schema task.
- Select the Options | Dependencies menu item.
The tooltip for a table entry contains the name of the table. The tooltip for the column entries contains the name of the column. If a column has a value template it is shown in the tooltip. If the column does not have a value template itself but is referenced by value templates belong to other columns then those columns are named in the tooltip.
When you select a column, the connections to other columns are highlighted in color. A tooltip shows the sender and subscriber relationship of the column dependencies. The tooltip contains the names of tables that refer to each other. The sender, subscriber, and the part of the value template that gives the reason for the dependency are also shown.
Table 13: Meaning of colors for sender subscriber relations
| Green |
Column is sender. |
| Red |
Column is subscriber. |
Related topics
