View the session details of each session for in-depth information on each of the indexed session stored in the connection database. You can use it to gain contextual insight about the indexed session and its events.
You can view session details for data recorded by:
Frequent Item Set (FIS) flow view visuals
Frequent Item Set (FIS) flow view visuals are also available on the Analytics tab. The FIS flow view is similar to the flow view analytics overview, except that the FIS flow view only displays data narrowed down to a single user's previous sessions in the analysis period (which is the previous 90 days by default). For more information, see Visualizing Frequent Item Sets on the FIS flow view.
Session tags
Session tags allow you to get basic information about the session and its contents at a glance.
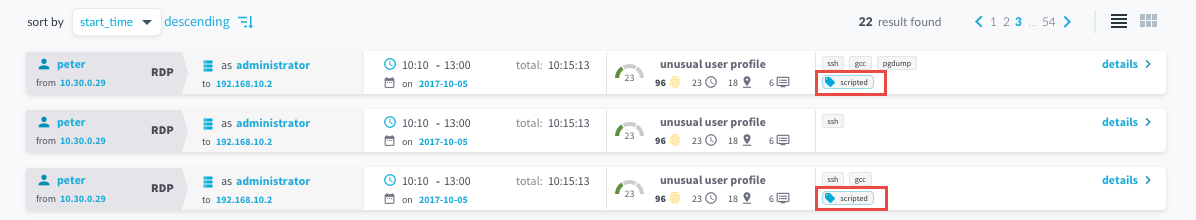
Scripted session tag: One Identity Safeguard for Privileged Sessions (SPS) currently supports the scripted session tag. SPS uses One Identity Safeguard for Privileged Analytics to detect if sessions are generated using human interaction or automation. If sessions are generated using automation, SPS displays the scripted tag in the search interface as shown below:
-
Scripted sessions are shown on the main search screen.
Figure 272: Scripted sessions — cards view
-
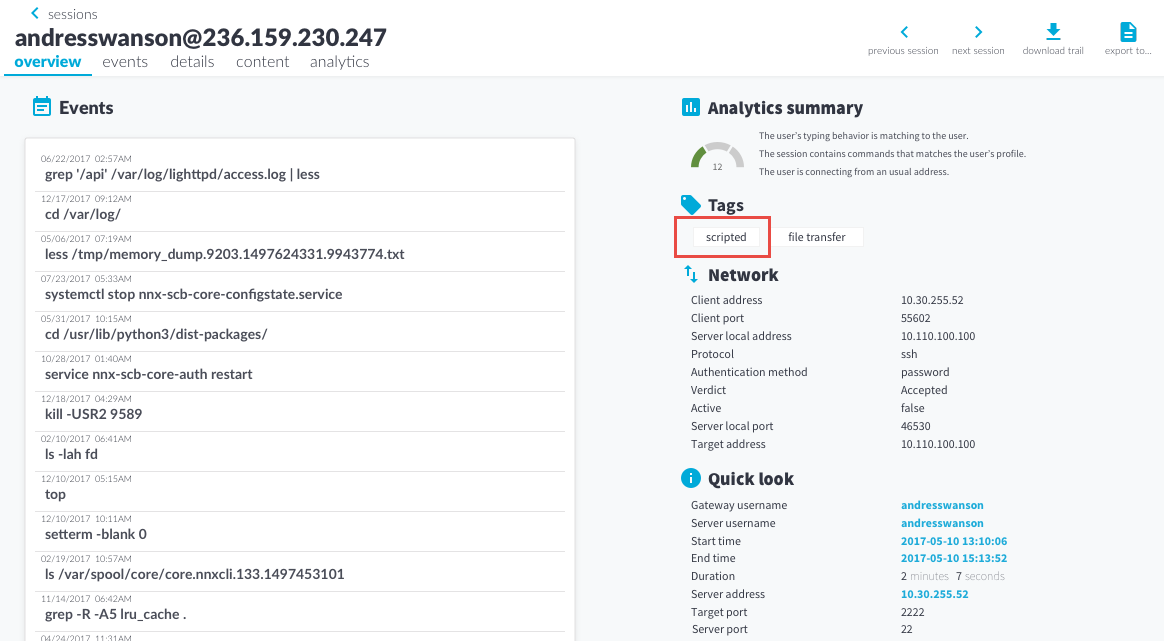
Scripted sessions are shown on the Overview tab.
Figure 273: Scripted sessions — Overview tab
From the Search interface, you can view session details for data recorded by SPS. To view session details for data recorded by Safeguard for Privileged Passwords (SPP), see Viewing session details for data recorded by SPP.
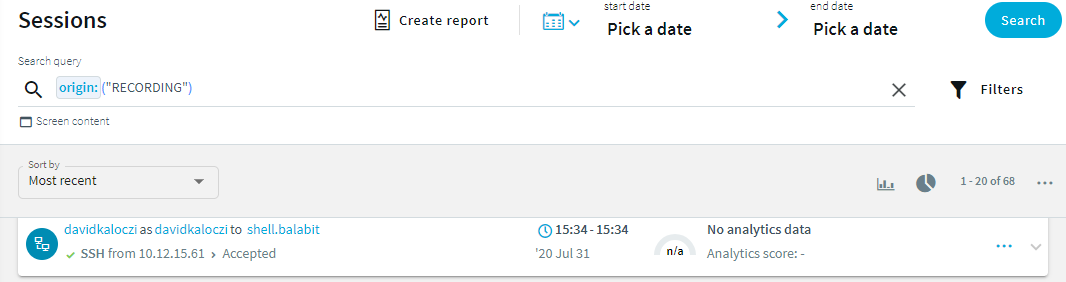
The  icon in the Search interface indicates that data was recorded by SPS. To search only for data recorded by SPS, enter origin:("RECORDING") in the Search query field.
To view session details, click the  button in the last column of the relevant session.
Figure 274: Search — Accessing session details
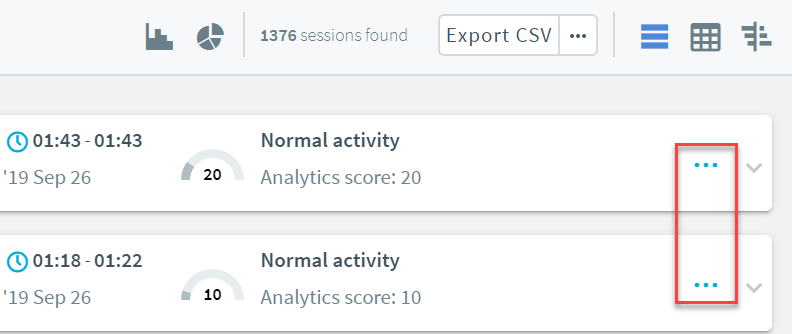
Figure 275: SPS session details
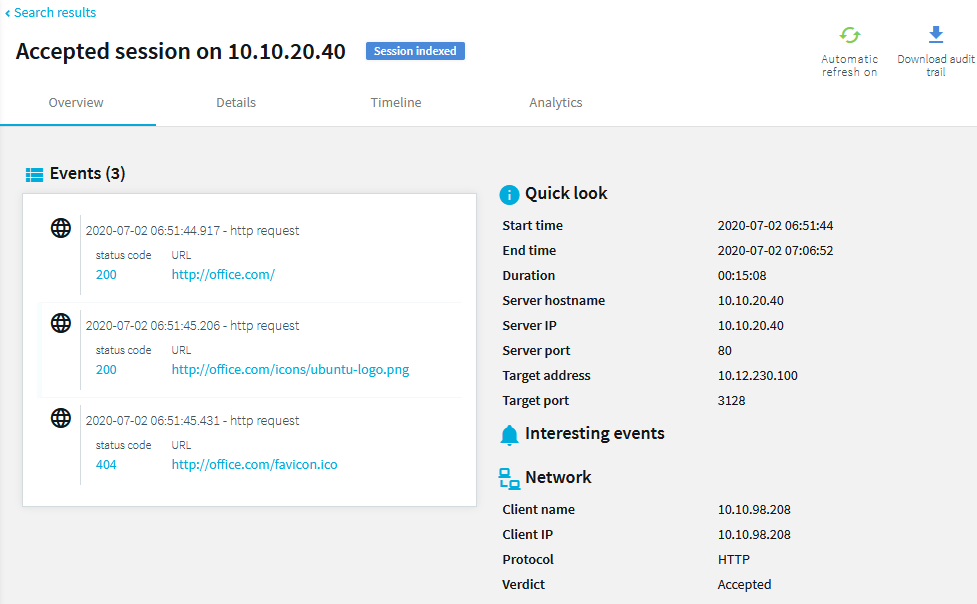
The session details window provides details about the sessions on tabs.
Overview tab
The Overview tab is divided into the following main areas:
-
The Events area displays session events in chronological order.
View the date and time of the event, the event type and event details. To filter events, use the Timeline tab.
- The Score area shows the risk score that the Analytics Module assigned to the session. Ranges from 0 to 100, 100 is the highest risk score.
-
The Quick look area contains user information, for example, gateway and server username, start and end time of the session, and so on.
The gateway username corresponds to the Username field of the connection metadata database, so note the following:
-
If the user performed inband gateway authentication in the connection, the field contains the username from the gateway authentication (gateway username).
-
Otherwise, the field contains the username used on the remote server.
-
The Interesting events area displays events selected as interesting, for example, a list of commands and window titles from the session that could be interesting from a security point of view.
The list of interesting events is currently hard-coded and cannot be modified. For terminal sessions it includes commands such as chmod, ssh, shutdown, sudo, su, mount, adduser, addgroup. For graphical sessions, it contains window titles such as Management Console, Control Panel, Server Manager, PowerShell, Security Settings, Windows Security Center.
-
The Network area displays session information, for example, verdict, protocol, connection policy, client and server address.
Details tab
In addition to the Quick look, Interesting events, and Network screen areas, the Details tab provides monitoring information, audit trail downloads information, and channels information, too.
If there is a gateway authentication or authorization failure due to an AA plugin, the reason of the failure is displayed in the Deny reason field.
Timeline tab
From the Search interface, for data recorded by SPS, you can view session events and alerts on a timeline, and search in the contents of the audit trail. The Timeline tab replaces the now deprecated Events, Alerts, and Contents tabs.
Figure 276: Timeline tab
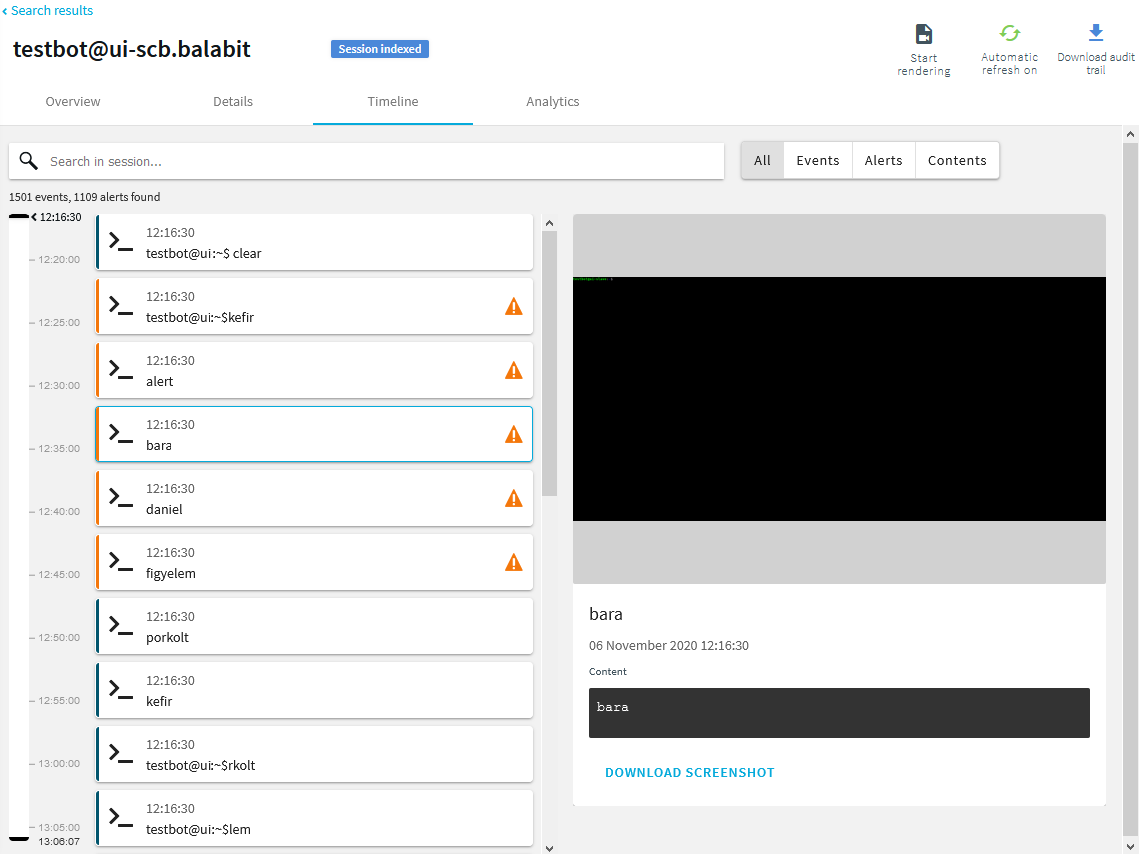
Events:
-
Session events in chronological order.
You can narrow the event list by entering the event name in the Search in session field.
-
Date and time of the event.
-
Event type (command, screen content, window title).
-
Event details.
-
Screenshots.
Alerts:
-
Content policy alerts triggered in the session, in chronological order.
You can narrow the alert list by entering the alert name in the Search in session field.
-
Date and time of the alert.
-
Alert details.
-
Screenshots.
Contents:
You can search in the contents of the audit trail using plain-text search. Searching using complex keyphrases is not supported from the Timeline tab.
Screenshots:
Screenshots. If screenshots are available for the session, you can click each event or alert to view the corresponding screenshot.
Screenshots are not available for:
-
Ongoing sessions.
-
Unindexed sessions.
-
Trails of HTTP sessions.
-
Encrypted trails (without the necessary certificate).
If screenshots are encrypted, you have to upload the necessary encryption key to your keystore. For more information, see Viewing encrypted screenshots.
Analytics tab
If you use the One Identity Safeguard for Privileged Analytics, you can view detailed analyses provided by the configured algorithms. For more information, see Analyzing data using One Identity Safeguard for Privileged Analytics.
Viewing active connections
If a connection is not closed and is still active, the  label is displayed in the session details window.
To close an active connection, click the  label.
You can also view the live connection as follows:
-
Click the  label.
-
Download the audit trail.
Trail data is exported in .srs format, which you can open with the Safeguard Desktop Player application.
For more information on the Safeguard Desktop Player, see Safeguard Desktop Player User Guide.
From the Search interface, you can view session details for data recorded by SPP. To view session details for data recorded by SPS, see Viewing session details for data recorded by SPS.
If you have linked your SPS to your SPP deployment, the  icon in the Search interface indicates that data was recorded by SPP.
To search only for data recorded by SPP, enter origin:("VAULT") in the Search query field.
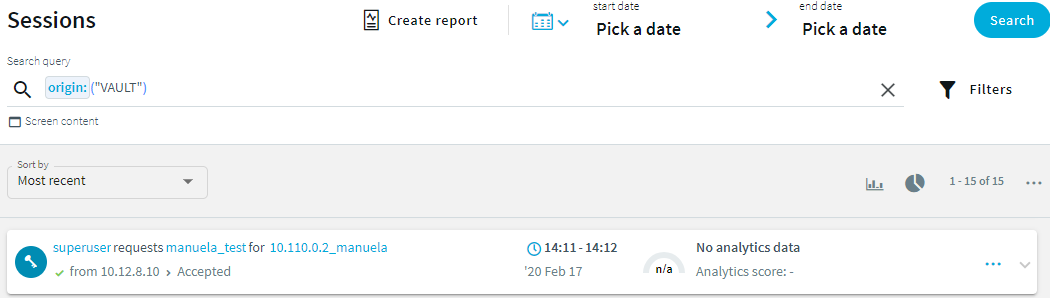
To view session details, click the button in the last column of the relevant session.
Figure 277: Search — Accessing session details
Figure 278: SPP session details
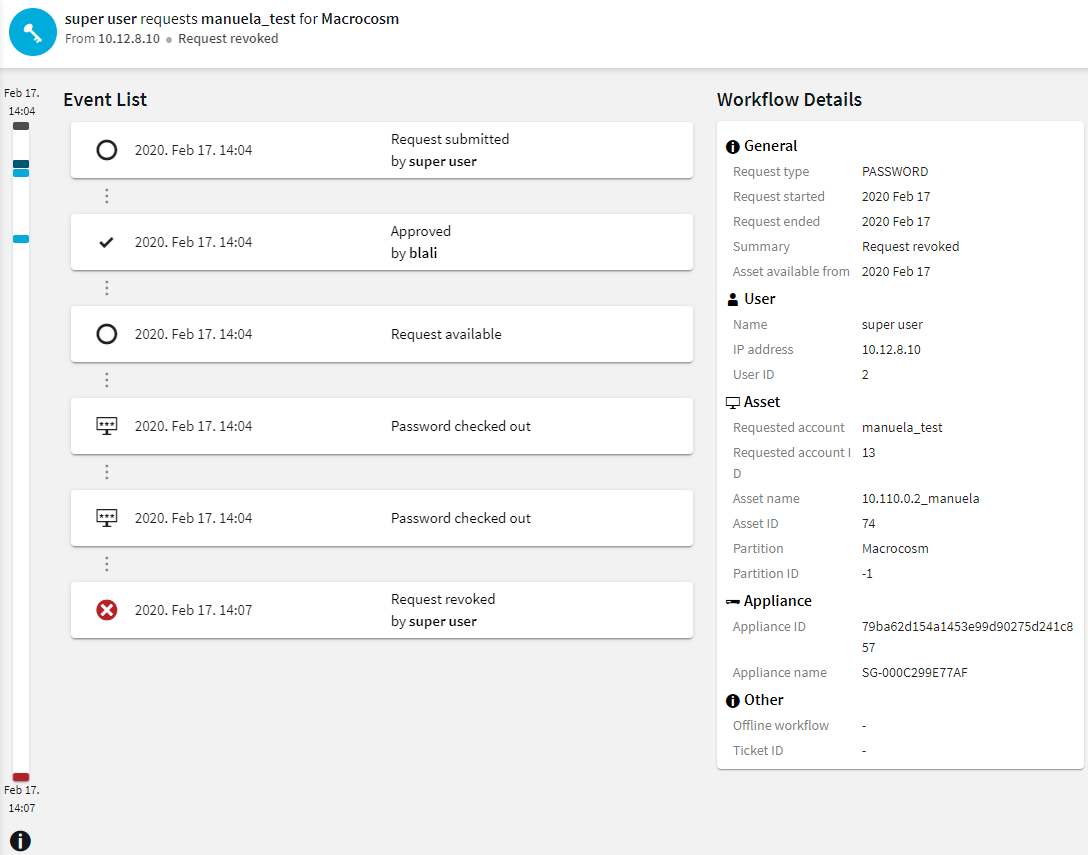
You can quickly visualize the session details in a timeline. To access the color legend for the timeline, click  (Timeline Color Legend). Hovering your mouse over an event shows the position of that event in the timeline sidebar. It also shows the event as active.
This section provides an overview of the Frequent Item Sets (FIS) flow view feature on the Search interface. It describes the underlying component (that is, the FIS algorithm), the elements of the FIS flow view visual, and possible scenarios (depending on your session details and pattern option choice).
From One Identity Safeguard for Privileged Sessions (SPS) version 6.2., a visual overview of Frequent Item Set (FIS) analysis is available on the Search interface. The FIS flow view is essentially similar to the flow view analytics overview, except that the FIS flow view only displays data narrowed down to a single user's previous sessions in the analysis period (which is the previous 90 days by default).
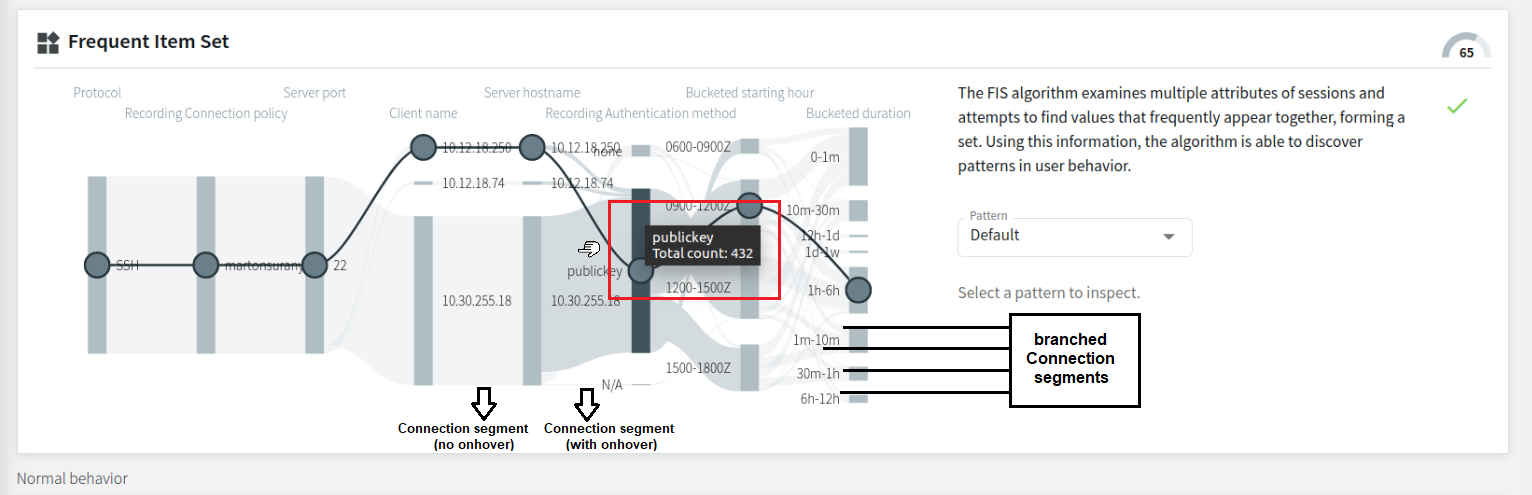
The component behind the analysis is the FIS algorithm, which examines multiple attributes of sessions and attempts to find values that frequently appear together, forming a set. Using this information, the algorithm can discover patterns in user behavior.
NOTE: For the FIS algorithm to be able to score a user's sessions, the user needs at least 1 FIS baseline built. Algorithm baselines (including the FIS baselines) are built automatically every day (usually during hours with less heavy traffic).
Elements of the FIS flow view
To access the FIS flow view feature, click on  of the session of your choice in Search > Sessions list, then click Analytics.
Figure 279: Search — The FIS flow view on the Analytics tab
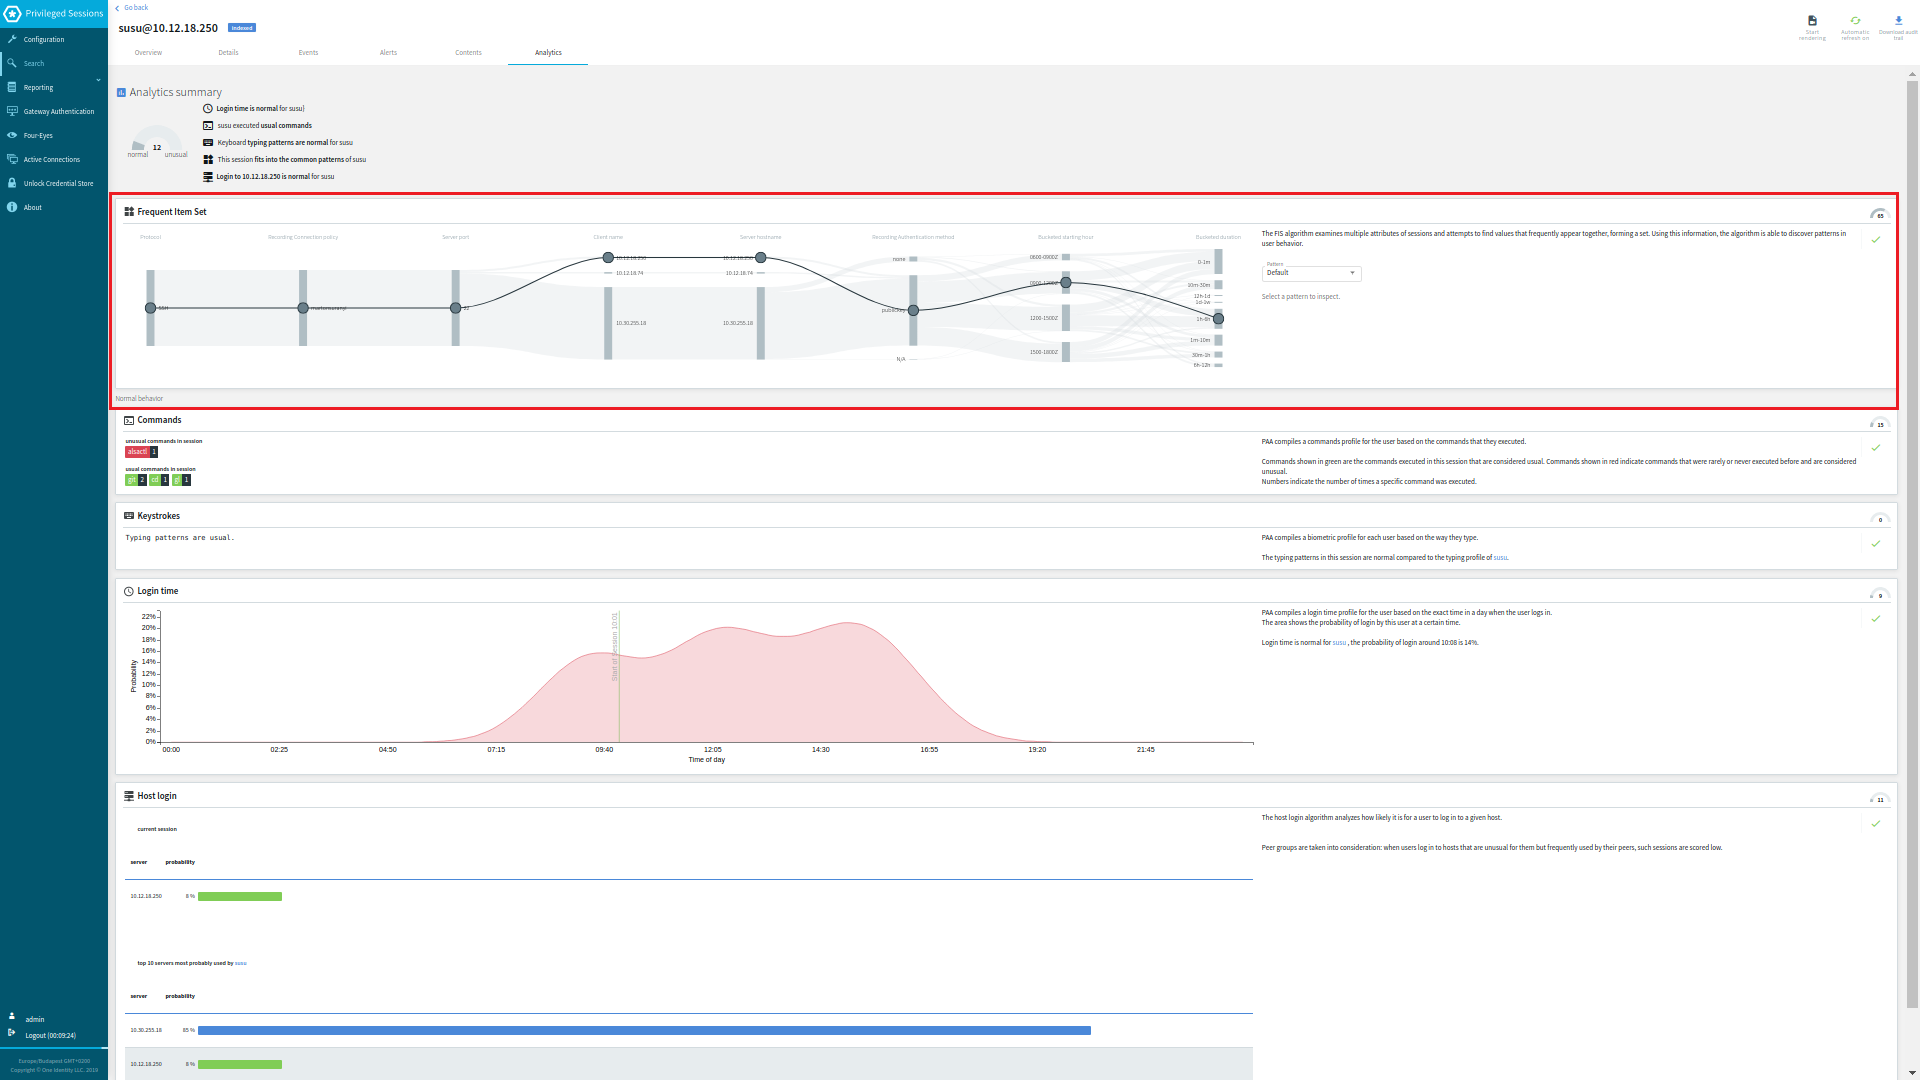
Figure 280: Search — The FIS flow view (close-up)
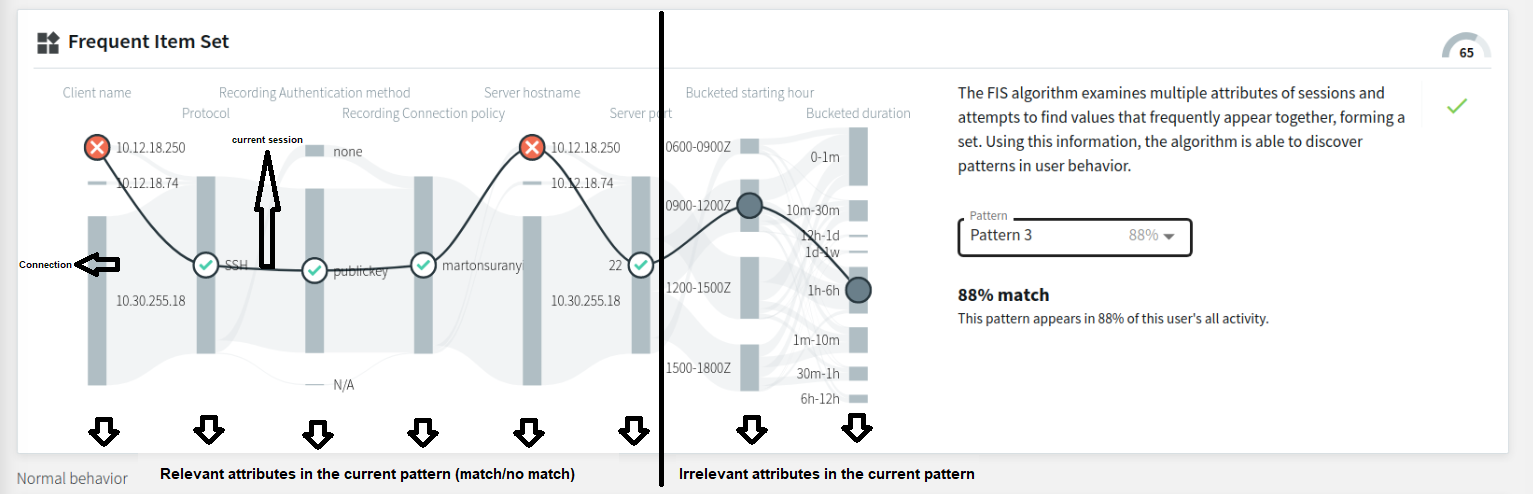
The layout of the FIS flow view is similar to the attributes-grouped flow view, with the sessions forming a flow line (from here on referred to as a Connection). The relevant examined attributes (including the attribute nodes) are visible on the left hand side, while the irrelevant attributes (including the attribute nodes) are on the right hand side of the flow line visual.
The continuous line, with circles representing attribute nodes (that can be gray (  ) or contain the
  or the
  mark), displays the current session. Each attribute node represents that particular attribute's value in the current session. The FIS algorithm attempts to match these attribute values to the patterns in the user's baseline.
The different attribute node markings stand for:
: session data for this attribute is irrelevant for pattern match comparison (or session data is part of the Default option)
: session data for this attribute is a match for the selected pattern
: session data for this attribute is not a match for the selected pattern
Attributes
Similarly to the flow view, session data in the FIS flow view is grouped according to attributes (such as Protocol, Client name, Server hostname, Server port, and so on) that come from session data. The two attributes in the FIS flow view that do not come from session data as-is, but are further grouped instead:
-
Bucketed starting hour: the most frequently used session starting hours grouped into intervals of 3 hours each
-
Bucketed duration: the most frequently occurring session duration values, grouped into intervals of various length
The FIS score gauge
The FIS score gauge (located in the upper right corner of the FIS flow view visual) indicates the FIS score of the selected session.
Figure 281: Search — The FIS score gauge
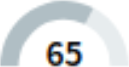
The FIS score is assigned to the session after the FIS algorithm analyzes it in comparison with the latest available baseline. If the session has a high amount of matches to the user's baseline, the FIS score's value will be low (indicating normal user behavior).
The value of the FIS score (also visible on the Search > Sessions list, as well as in the aggregated score summary, usually above the FIS flow line visual) is one of the several components of the session's aggregated score.
Figure 282: Search — The FIS score visible on Search > Sessions list

For more information about analytics algorithms and scores, see this section.
Pattern selection drop-down list
The pattern selection drop-down list (by default set to the Default option) offers the available patterns that the FIS algorithm generates after baseline analysis.
Figure 283: Search — The pattern selection drop-down list (set to the Default option)
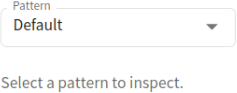
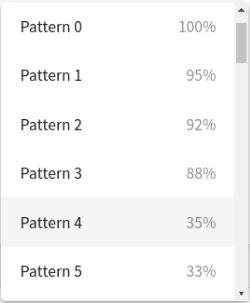
Figure 284: Search — The pattern selection drop-down list (further options)
Depending on which available pattern option you select, the visual will display one of these cases:
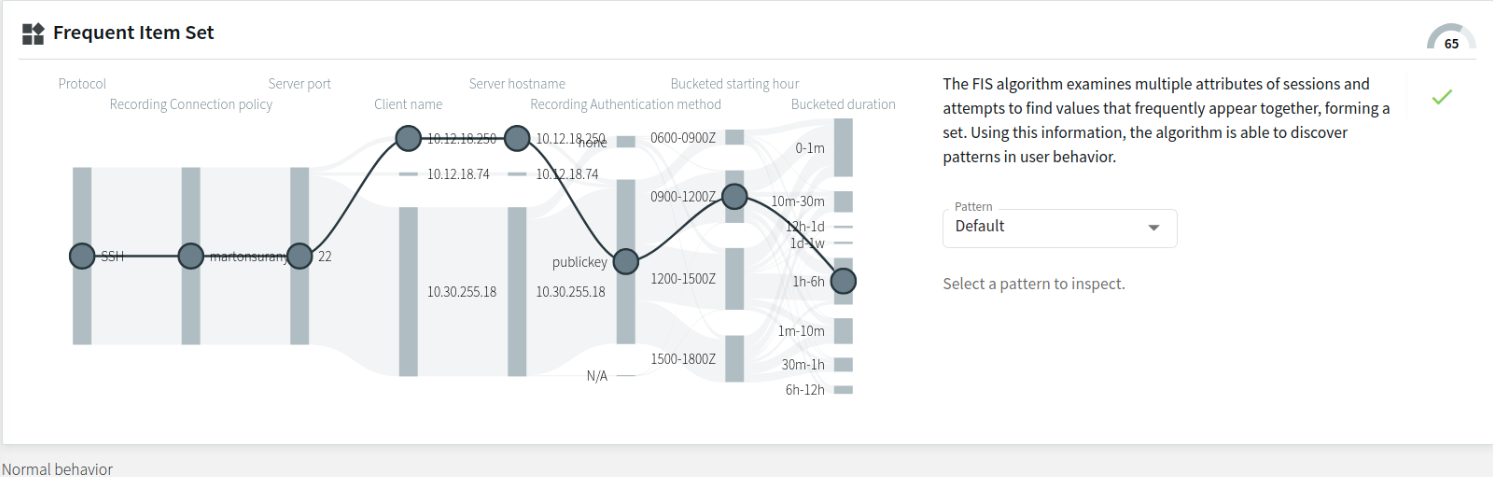
- The Default option
The Default option is the set of values that the FIS algorithm takes as a reference point. If you select the Default option, the flow line visual displays the user's previous sessions in the observed analysis period, with no patterns selected yet. The flow line visual below (set to the Default option) displays all possible attributes, marked with in all attributes.
Figure 285: Search — FIS flow view - the Default option (no patterns displayed yet)
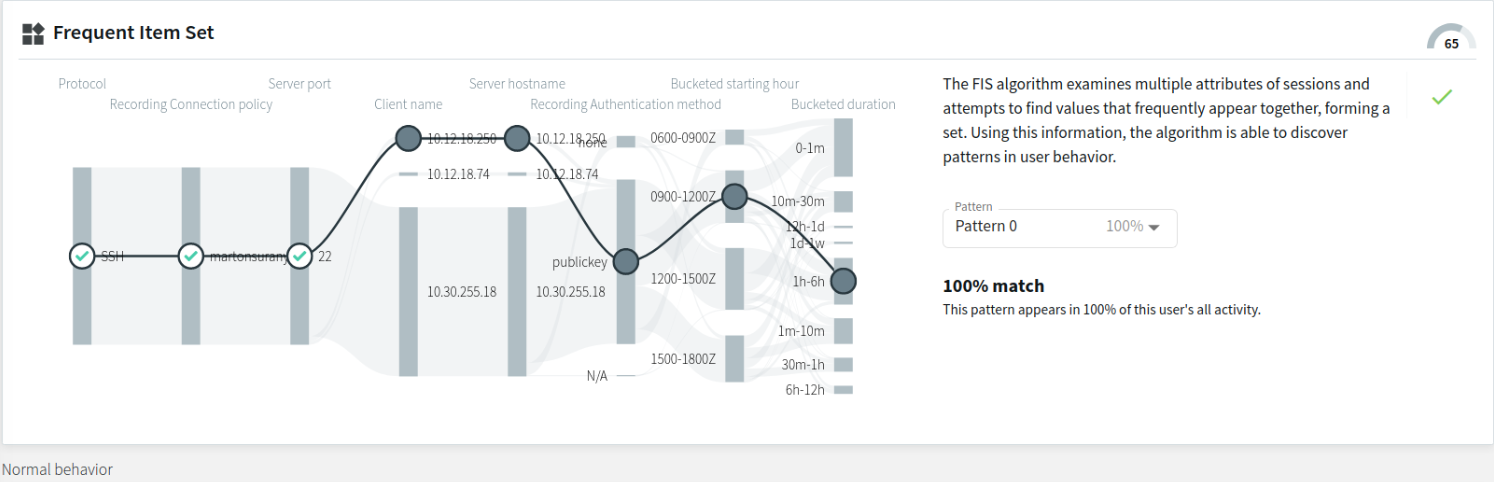
- Pattern with a 100% match to this user's sessions during the observed analysis period
The example below displays a pattern that appears in 100% of the user's previous sessions during the analysis period. As mentioned before, the relevant attribute nodes (marked with the or the sign, depending on whether that attribute value matches or does not match the Default option in that particular session) are arranged on the left-hand side, while the irrelevant ones (marked with ) are arranged on the right-hand side of the flow line visual. There are 3 attribute matches (namely, Protocol, Recording Connection policy, and Server port) to this particular pattern in this particular session.
Figure 286: Search — FIS flow view - a pattern with a 100% match
- Pattern with a high match percentage to this user's sessions during the observed analysis period
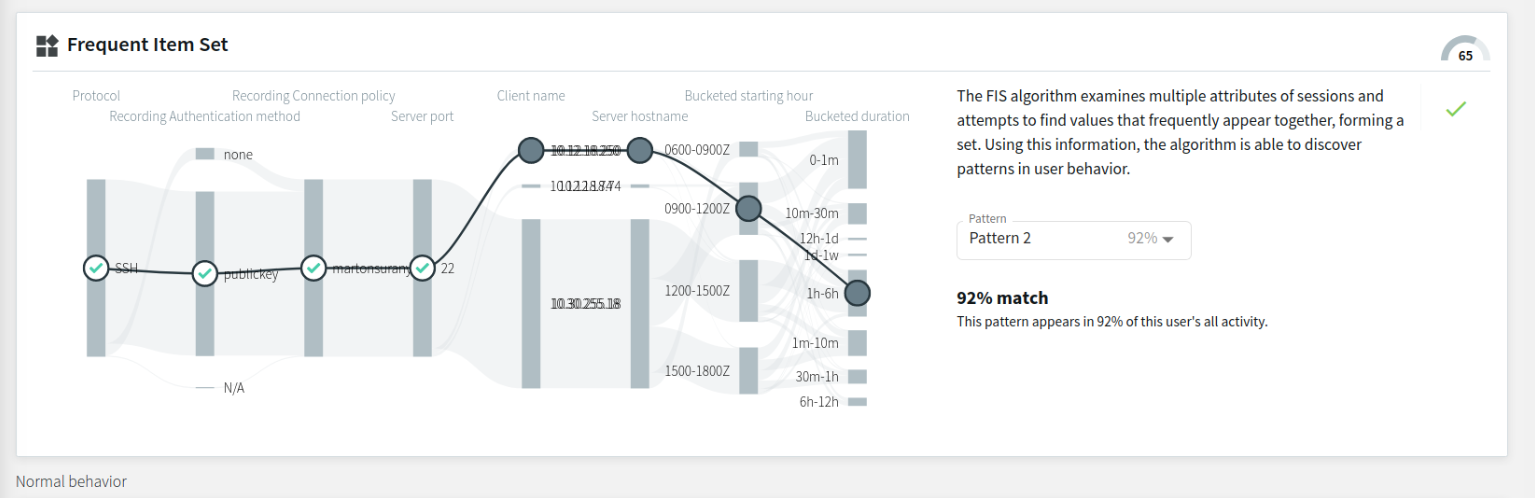
The example below displays a pattern that appears in 92% of the user's previous sessions during the observed analysis period. Similarly to the previous example, the relevant attribute nodes are arranged on the left-hand side, while the irrelevant ones are arranged on the right-hand side of the flow line visual. This example contains different relevant attribute nodes than the previous example, with 4 attribute matches to this particular pattern in this particular session.
Figure 287: Search — FIS flow view - a pattern with a high match percentage
- Pattern with a low match percentage to this user's sessions during the observed analysis period
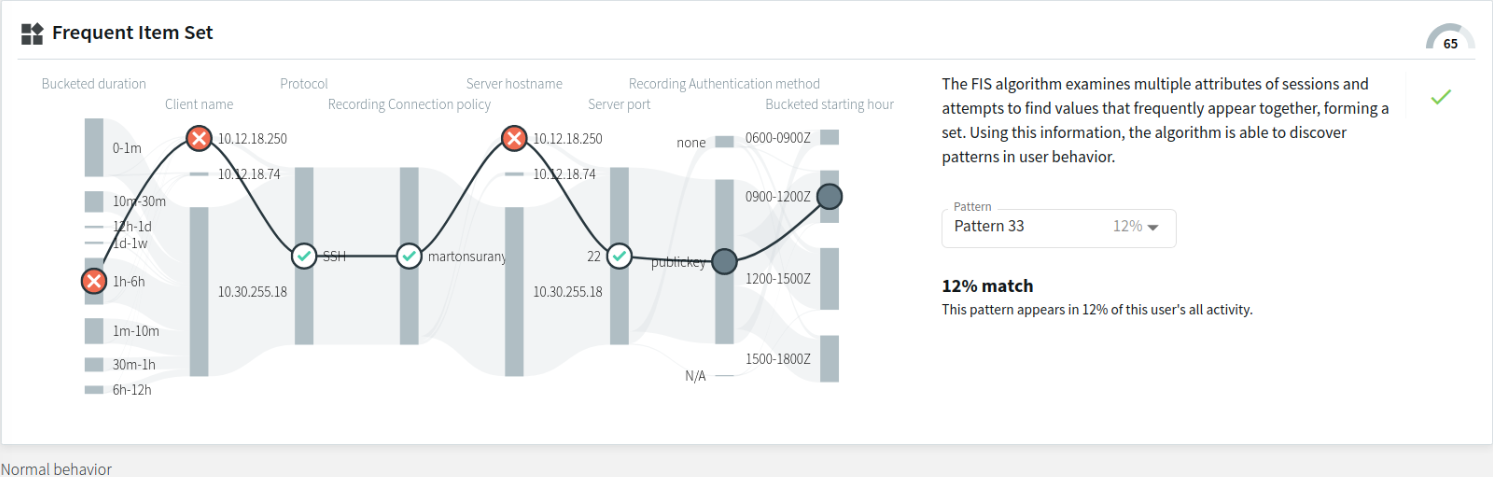
The example below displays a pattern with a low match percentage, appearing in only 12% of this user's previous sessions during the observed analysis period. There are 3 attribute nodes that match ( marked with ) and 3 attribute nodes that do not match ( marked with ) this particular pattern in this particular session.
Figure 288: Search — FIS flow view - a pattern with a low match percentage
With the baseline generated every day on average (usually during hours with less heavy traffic), the baseline itself is continuously changing. As a result, the available patterns are also continuously changing over time.
Pattern match percentage
The pattern match percentage is a percentage value displayed under the pattern selection drop-down list, next to the pattern name (for example, Pattern 0 | Pattern 1, and so on).
Figure 289: Search — FIS flow view - the pattern match percentage
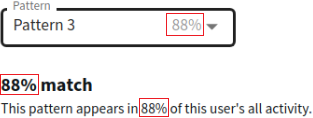
The percentage value always matches the value displayed next to the Pattern options (other than the Default option) in the drop-down list. The percentage indicates to what percent the selected pattern matches this user's sessions during the observed analysis period. Patterns that appear in less than 10% of this user's sessions during the observed analysis period are not displayed in the drop-down list as Pattern options (but may appear in the overall sum of Total count data, as mentioned in Displaying further details of individual Connection segments.
Displaying further details of individual Connection segments
Hovering on an individual Connection segment of the visual displays the exact number of occurrences of that particular attribute value during the observed analysis period. When the Connection splits to several branches (for example, in the example below, the Connection splits into separate branches according to Bucketed starting hour), hovering over the branched Connection segment of your choice will display that particular attribute's further details (namely, the attribute data (for example, IP addresses), and the Total count).
NOTE: The Total count values include session data originating from patterns that appear in less than 10% of the user's sessions during the observed analysis period.
Figure 290: Search — Hovering on particular Connection segments to display further details