One Identity Safeguard for Privileged Sessions (SPS) integrates data from SPS to use as the basis of user behavior analysis. SPA uses machine learning algorithms to scrutinize behavioral characteristics (using data from SPS), and generates user behavior profiles for each individual privileged user. SPA compares actual user activity to user profiles in real time, with profiles being continually adjusted using machine learning. When SPA detects unusual activity, this is indicated on the user interface of SPS in the form of high scores and visualized insight.
Prerequisites
Make sure that you have session data from network traffic that:
-
contains real, unique usernames linked to users other than root/administrator or a shared account
To check this, navigate to Search, and check whether the Username column contains data. This is important, because session data will be linked to users.
If you do not have unique usernames in your session data, review your authentication settings and consult with the One Identity Professional Services team to learn about your options to tie accounts to users.
-
has commands extracted (using lightweight or full indexing, or in real-time through content policies)
For instructions on how to configure indexing and include commands in the scope of indexing, see "Indexing audit trails" in the Administration Guide.
For details on how to configure real-time command extraction using a content policy, see "Creating a new content policy" in the Administration Guide.
-
has keystrokes extracted (using lightweight or full indexing, or in real-time through content policies)
The minimum required amount of data for reliable insight is 5 sessions with approximately 200 keystrokes each.
For instructions on how to configure indexing and include typing biometrics in the scope of indexing, see "Indexing audit trails" in the Administration Guide.
For details on how to configure real-time extraction of keystroke-related data using a content policy, see "Creating a new content policy" in the Administration Guide.
-
has pointing device (mouse) biometrics extracted (using lightweight or full indexing, or in real-time through content policies)
For instructions on how to configure indexing and include pointing device biometrics in the scope of indexing, see "Indexing audit trails" in the Administration Guide.
For details on how to configure real-time extraction of pointing device-related data using a content policy, see "Creating a new content policy" in the Administration Guide.
-
has window titles extracted (using lightweight or full indexing, or in real-time through content policies)
For instructions on how to configure indexing and include window titles in the scope of indexing, see "Indexing audit trails" in the Administration Guide.
For details on how to configure real-time window title extraction using a content policy, see "Creating a new content policy" in the Administration Guide.
The following describes how to analyze data using One Identity Safeguard for Privileged Analytics.
Limitations
SPS used in combination with SPA currently has the following limitations:
-
SPA requires at least 12GB RAM to operate. If you are interested in upgrading your appliance, contact our Support Team.
-
SPA requires a lot of computation, which can put pressure on SPS:
-
The keystroke algorithm is much more resource-hungry than the other algorithms, therefore our recommendation is to start analyzing data using the algorithms that require less resources.
-
Before you start using SPA, make sure that at least half the capacity of SPS is available.
-
SPA only analyzes audit trails and SPS metadata, it does not analyze log data.
To start using SPA
-
Start getting scores.
Scoring happens in real-time, meaning that as soon as new data (even data from an ongoing session) is available, SPA immediately scores it.
Scores represent an aggregated amount. Session data is scored by multiple algorithms independent from each other. Scores given by individual algorithms are aggregated to create a single score.
For detailed instructions on how to configure SPA, see Safeguard for Privileged Analytics Configuration Guide.
-
Search for sessions with high scores.
-
Go to Search.
Sessions are displayed sorted by date. For ongoing sessions, the Search interface is updated in real-time to always show the most up-to-date information.
-
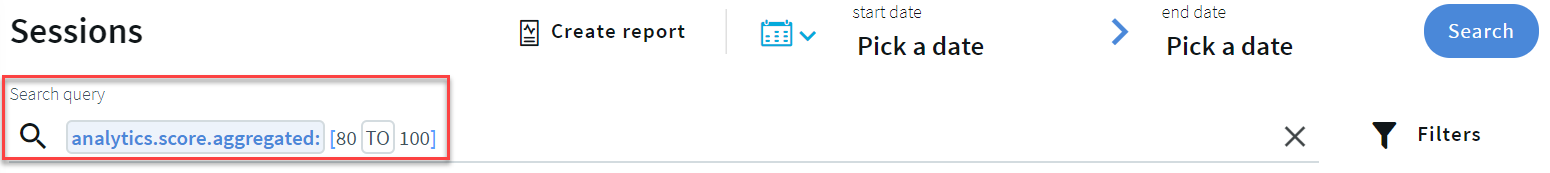
In the Search query field, type analytics.score.aggregated: [80 TO 100], and click Search.
A score between 80 and 100 indicates unusual user behavior.
Figure 286: Searching for sessions with unusual user behavior using a search query
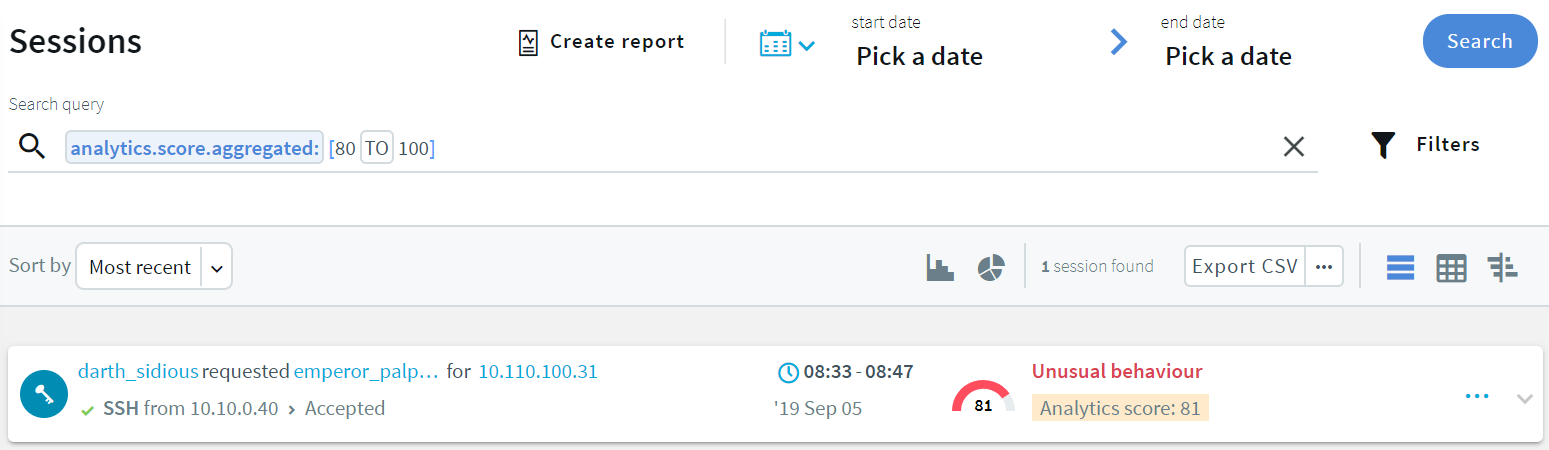
Results that show sessions with high scores are displayed.
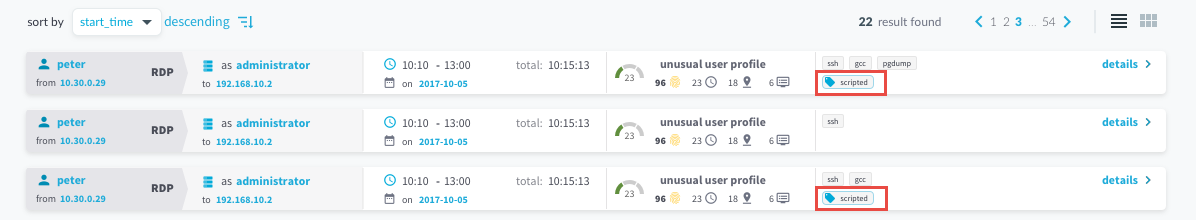
Figure 287: Sessions with high scores — table view
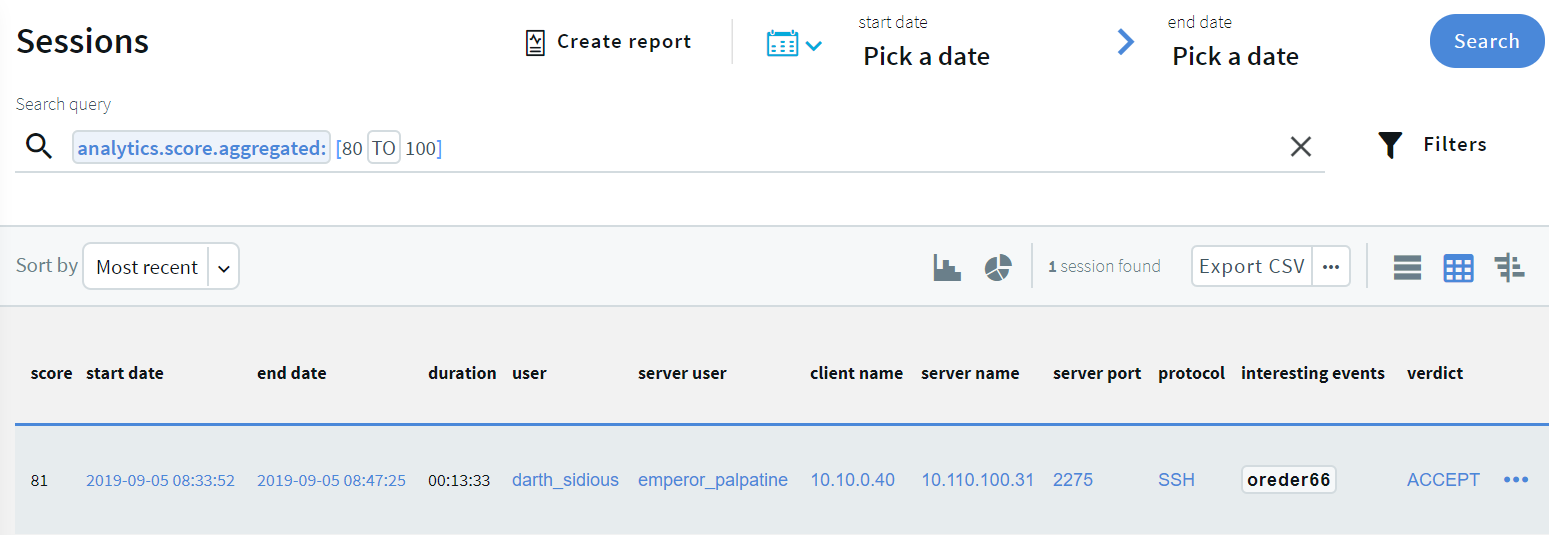
Figure 288: Sessions with high scores — card view
-
Alternatively, search for scripted sessions.
In the Search query field, type analytics.scripted:true, and click Search.
-
View the details of a session.
To view details of a session, click  .
.
-
View session analytics.
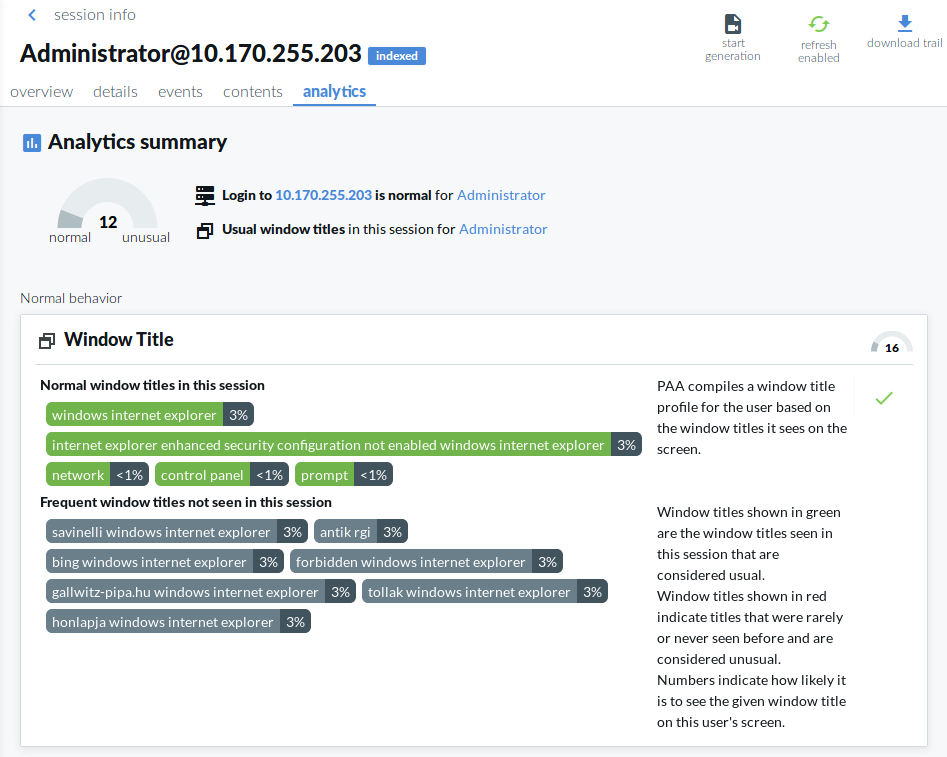
Click the Analytics tab.
The top of the page displays a summary of key insights about the session, such as:
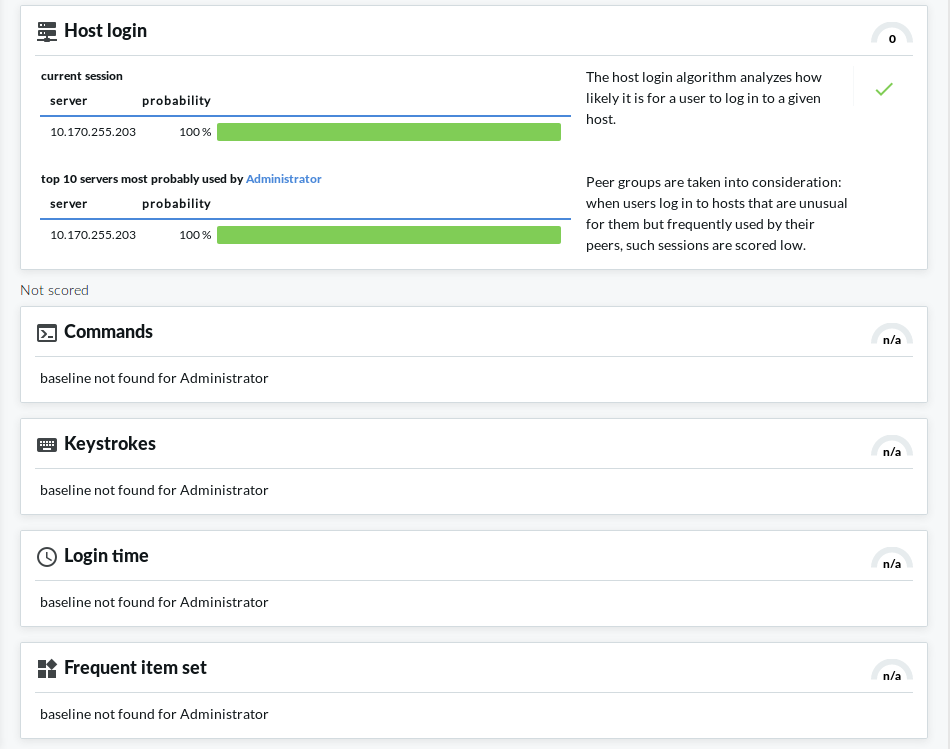
The Anomalies found and Normal behavior sections of the page display detailed analyses provided by each of the configured algorithms. This includes short information on how a particular algorithm works and how to read the visualized insight, as well as scores given by the individual algorithms.
Figure 289: Search — Viewing details on the Analytics tab: Anomalies found
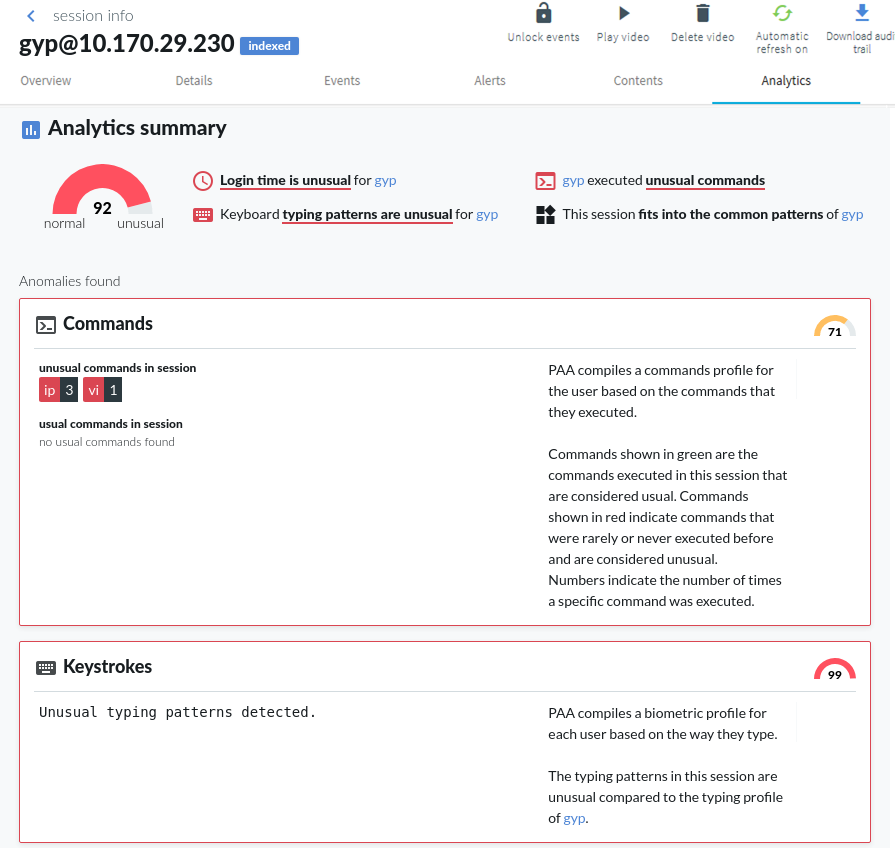
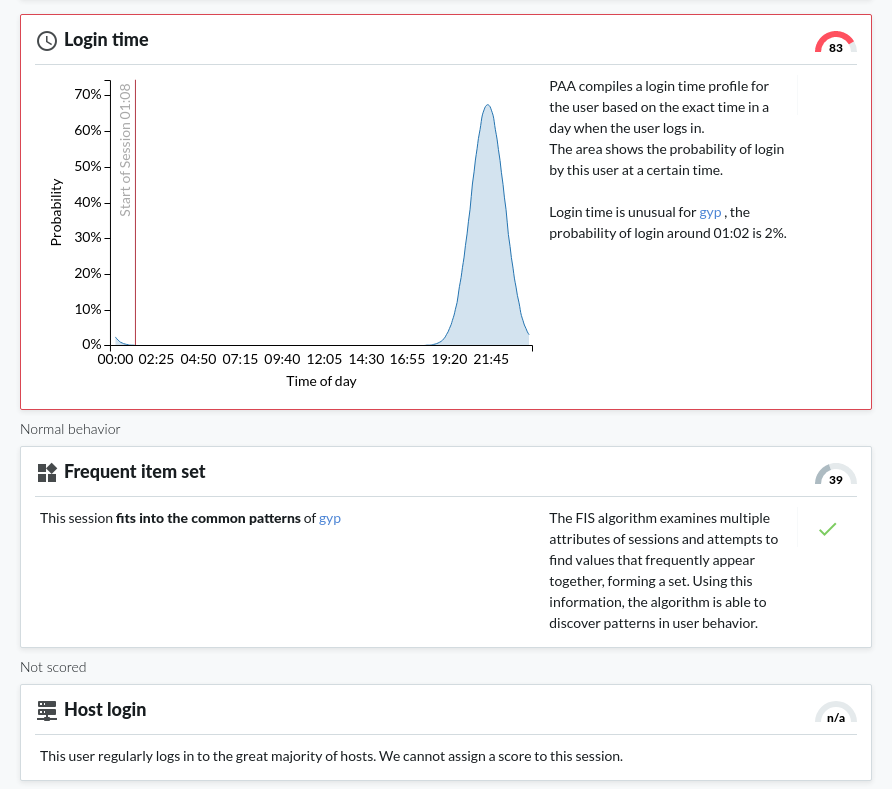
Figure 290: Search — Viewing details on the Analytics tab: Normal behavior
The screen content is first indexed, then processed with the search backend, and finally, the filter expressions are applied. This process is described in detail in the following sections.
Figure 291: The search and filter process
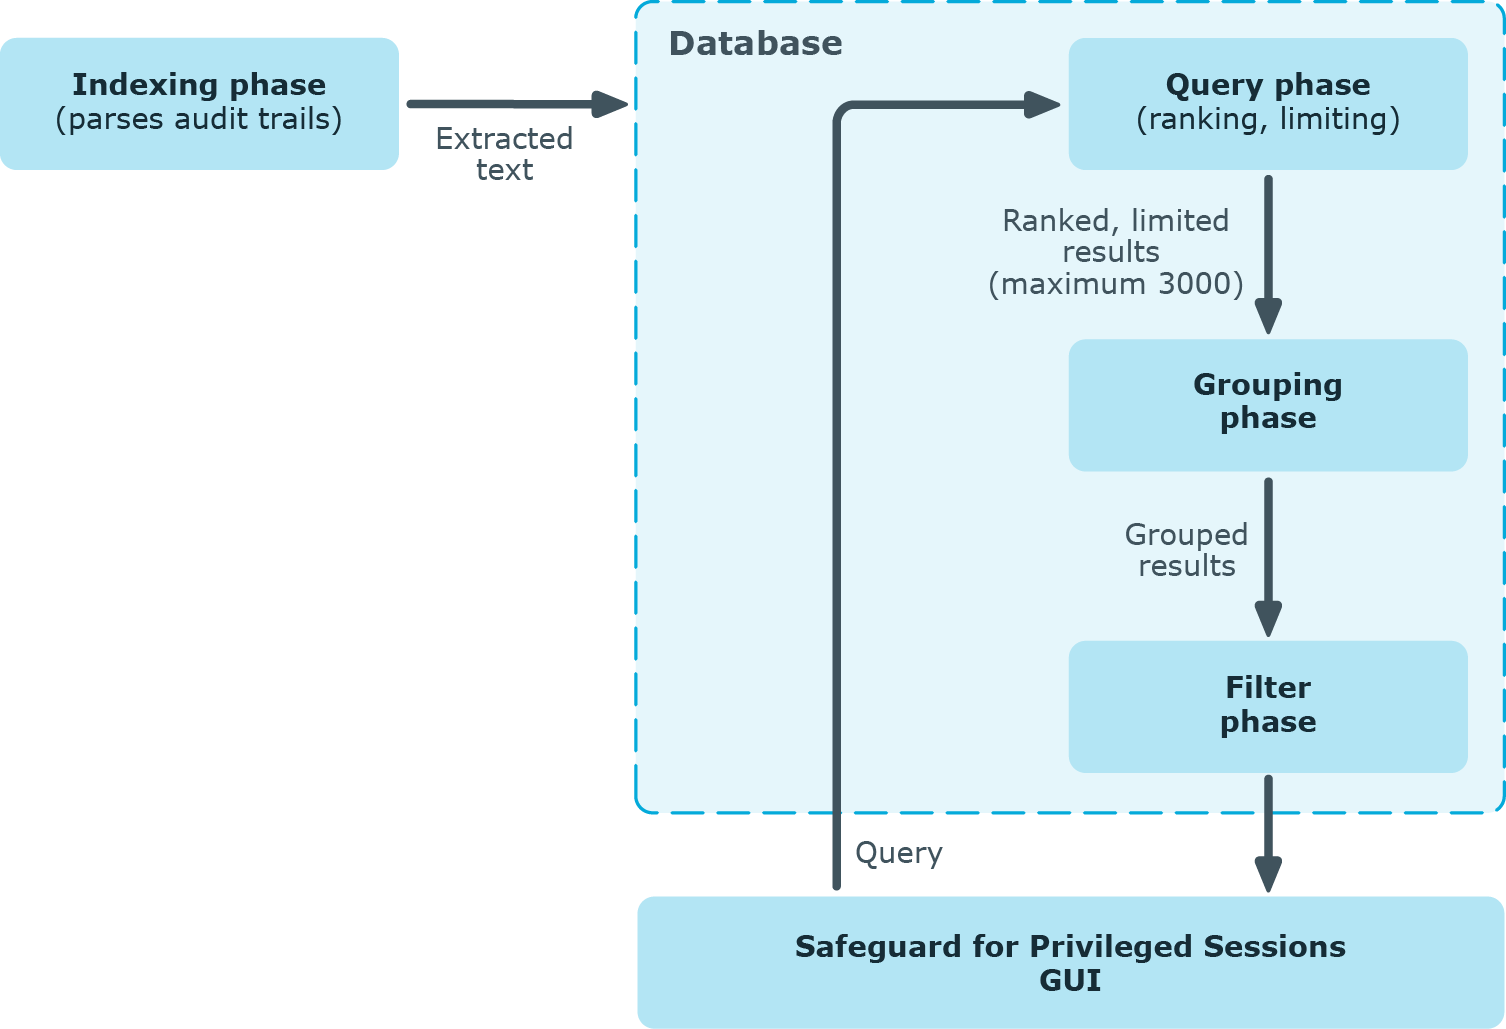
Prerequisites - Indexing phase
First, as a prerequisite of the search process, screen content is indexed. The indexing phase generates a database that the search and filter processes will run on.
The indexer parses the audit trail files, and builds an "inventory" of the privileged user's activity data based on what appeared on their screen.
-
In the case of a terminal session, screen content corresponds to the activity data that is captured in a terminal window. In the case of graphical protocols, screen content is whatever is visible in the graphical user interface of the applications the user is interacting with. In the latter case, the indexer's Optical Character Recognition (OCR) engine extracts text that appeared on the screen (for example, window titles).
NOTE: If a piece of text is displayed for less than 1 second, it is not extracted.
-
The indexer returns the information extracted from the parsed audit trail files to One Identity Safeguard for Privileged Sessions (SPS). In the case of a terminal session, the captured text is put in the backend database as one document per one second of screen content. Because of this, the content that you have searched for might only partially appear in the screenshot. In the case of graphical protocols, the captured text is put in the backend database as one document per screenshot.
-
The queries will be run on this database during the search process.
For details on indexing, see Indexing audit trails.
Search and filter process phases
The search and filter process consists of three major phases:
-
Query phase
-
Grouping phase
-
Filter phase
Query phase
In the query phase, the backend ranks and then limits the number of results.
-
The result of one query is the top 3000 documents, ordered by the default ranking system of the backend.
This means that if there are more than 3000 results, those of the lowest rank will not be passed to the next phase at all.
The ranking system cannot be modified, so there is no way to "upvote" those results of lower ranks.
If you want to ensure that all important results are passed to the grouping phase, use a smaller time range that you run the query on. If there are fewer than 3000 results, it is certain that the events you are interested in will be included in the grouping phase.
-
The grouping phase receives the results.
Grouping phase
The grouping phase groups the results that were passed on from the query phase.
-
First, the results with the same trail IDs are grouped together. A trail ID group contains all search hits that are in that trail.
-
The trail ID groups are then further grouped by seach expression and time range. This group is essentially the time range during which the expression is displayed on the screen (for example, if the text root is displayed from 00:00:12 to 00:01:45, this will be one group).
-
This grouped result is displayed in the search screen as one row.
Filter phase
The filter phase applies filter expressions to these grouped results.
NOTE: If there were screen content search results that were excluded during the query phase, the filter expressions will not be applied to them.
Example: Filtering for search results that were excluded in the query phase
For example, if you want to filter for Telnet connections where the text root was displayed, the following can happen:
You search for the Screen content: root. There are 3100 search results that consist of 3050 SSH connections and 50 Telnet connections. In this example, Telnet connections received the lowest ranks for some reason. 100 results that have received the lowest rank are excluded, and in this example it means all Telnet connections.
If you filter for protocol Telnet now, you will not see any results.
To remedy this situation, try searching in a smaller time range to make sure that there are less than 3000 search results. If you are unsure about the time range, you might want to attempt fine-tuning the backend search manually. For details, see: Fine-tuning the backend search manually.
Fine-tuning the backend search manually
You can fine-tune your search manually with the command line utility lucenectl. To do this, log on to the core shell. For details, see Accessing the One Identity Safeguard for Privileged Sessions (SPS) console.
-
Specify more exact time ranges (use Unix timestamps).
For example, to limit the time range to Thursday, June 30, 2016 11:39:51 AM - Thursday, November 3, 2016 2:44:46 PM, enter the following command:
indexerctl search --from-to 1467286791 1478184286 --text remote --limit 3000 --aggregate-by-trail --normalize-rank
-
Increase the query limit of 3000 to a limit of your choice.
For example, to increase the query limit of 3000 to 4500, enter the following command:
lucenectl search --from-to 1467286791 1478184286 --text <your-screen-content-search-expression> --limit 4500 --aggregate-by-trail --normalize-rank
lucenectl search --from-to 1467286791 1478184286 --text remote --limit 4500 --aggregate-by-trail --normalize-rank
NOTE: If you do not receive more results with a larger query limit, it means that you have found all results with your search expression.
However, the downside of using lucenectl to fine-tune your search is that after the cli search, you have to manually extract the trails that you find interesting with the help of the metadb.
The following example shows the output of a lucenectl search:
{
 "hits": [
   {
     "hits_count": 1,
     "channel_id": 1,
     "trail_id": "58",
     "rank": 0.4068610216585047
   },
   {
     "hits_count": 7,
     "channel_id": 761,
     "trail_id": "12",
     "rank": 1.0
   },
   {
     "hits_count": 2,
     "channel_id": 1,
     "trail_id": "139",
     "rank": 0.5923645275802537
   }
 ]
}
-
rank: the larger the number, the higher the rank
-
hits_count: the number of times the screen content search expression is displayed in the audit trail
-
trail_id: the ID of the trail
-
channel_id: the ID of the channel
The most relevant audit trail will probably be the one with the highest rank.
If you have determined which audit trail you are interested in, enter the following command. The value of _connection_channel_id will be the value of the trail_id from the lucenectl output that you have determined as most relevant.
psql -U scb scb -c "select audit from channels where _connection_channel_id = 12;"
The output of this command will be:
/<audittrailpath>/audit-scb_rdp-1467274538-0.zat:2
/<audittrailpath>/audit-scb_rdp-1467274538-0.zat:1
From this output, the audit trail file name path is as follows: /<audittrailpath>/audit-scb_rdp-1467274538-0.zat
NOTE: If you cannot find the file at the path, check whether it has been archived and search for the file in the archive path. Use the following command:
psql -U scb scb -c "select audit, _archive_path from channels where _connection_channel_id = 12;"
The output of this command will be:
                    audit                                | _archive_path
---------------------------------------------------------+---------------
/<audittrailpath>/audit-scb_rdp-1467274538-0.zat:2 | /<myarchive/path>/
/<audittrailpath>/audit-scb_rdp-1467274538-0.zat:1 | /<myarchive/path>/
                                                         |
If you still cannot find the audit trail, contact our Support Team.
View the session details of each session for in-depth information on each of the indexed session stored in the connection database. You can use it to gain contextual insight about the indexed session and its events.
You can view session details for data recorded by:
Frequent Item Set (FIS) flow view visuals
Frequent Item Set (FIS) flow view visuals are also available on the Analytics tab. The FIS flow view is similar to the flow view analytics overview, except that the FIS flow view only displays data narrowed down to a single user's previous sessions in the analysis period (which is the previous 90 days by default). For more information, see Visualizing Frequent Item Sets on the FIS flow view.
Session tags
Session tags allow you to get basic information about the session and its contents at a glance.
Scripted session tag: One Identity Safeguard for Privileged Sessions (SPS) currently supports the scripted session tag. SPS uses One Identity Safeguard for Privileged Analytics to detect if sessions are generated using human interaction or automation. If sessions are generated using automation, SPS displays the scripted tag in the search interface as shown below:
-
Scripted sessions are shown on the main search screen.
Figure 292: Scripted sessions — cards view
-
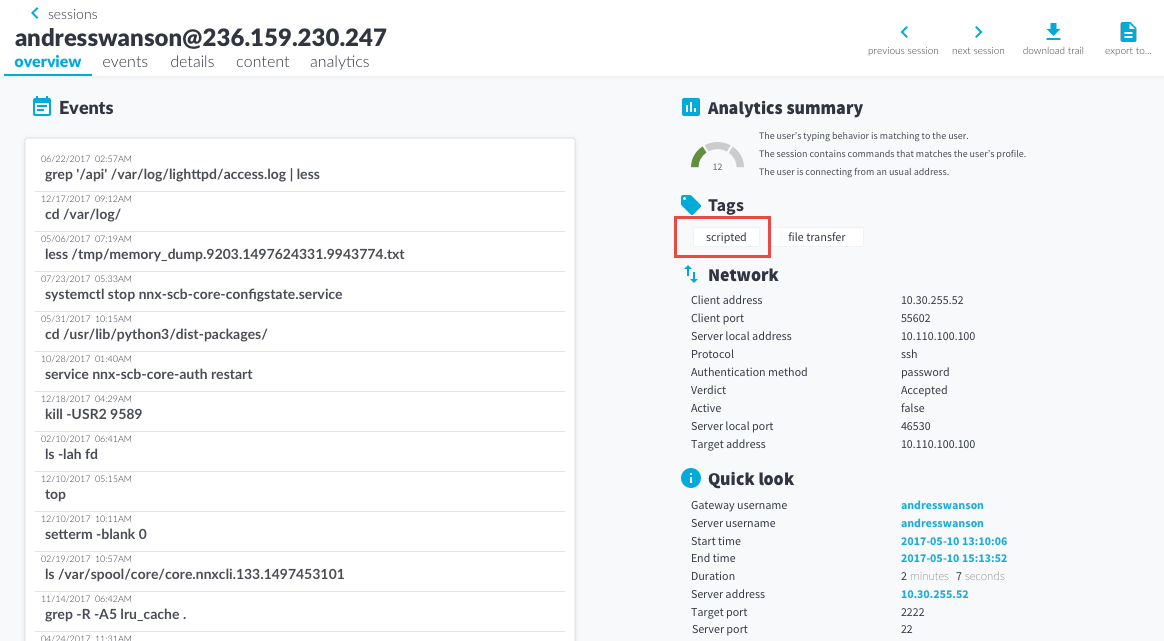
Scripted sessions are shown on the Overview tab.
Figure 293: Scripted sessions — Overview tab
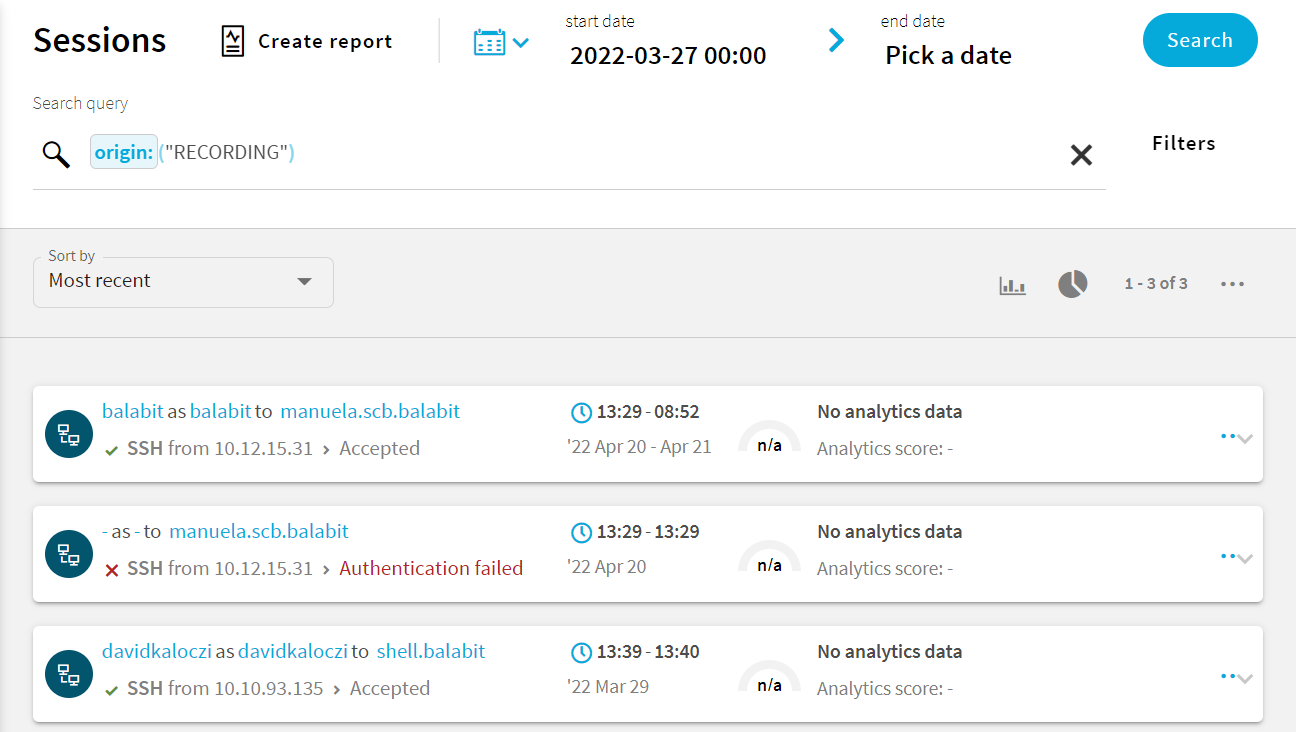
From the Search interface, you can view session details for data recorded by SPS. To view session details for data recorded by One Identity Safeguard for Privileged Passwords (SPP), see Viewing session details for data recorded by SPP.
The  icon in the Search interface indicates that data was recorded by SPS. To search only for data recorded by SPS, enter origin:("RECORDING") in the Search query field.
To view session details, click the  button in the last column of the relevant session.
Figure 294: Search — Accessing session details
Figure 295: SPS session details
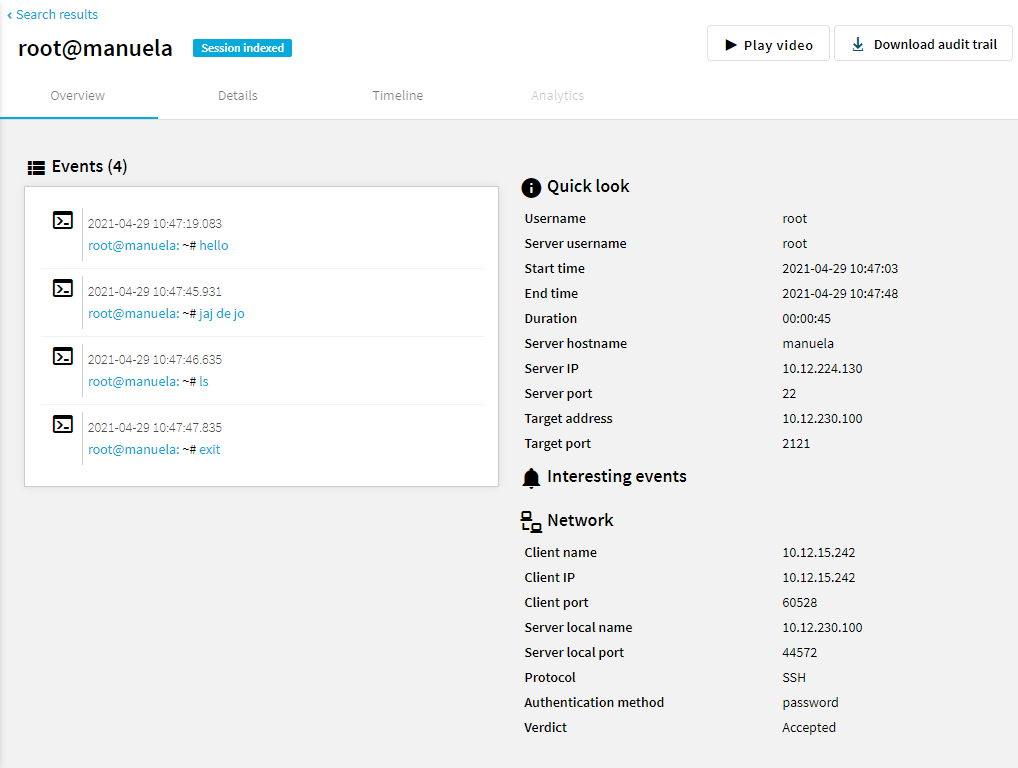
The session details window provides details about the sessions on tabs.
Overview tab
The Overview tab is divided into the following main areas:
-
The Events area displays session events in chronological order.
View the date and time of the event, the event type and event details. To filter events, use the Timeline tab.
- The Score area shows the risk score that the Analytics Module assigned to the session. Ranges from 0 to 100, 100 is the highest risk score.
-
The Quick look area contains user information, for example:
The gateway username corresponds to the Username field of the connection metadata database. Note the following:
-
If the user performed inband gateway authentication in the connection, the field contains the username from the gateway authentication (gateway username).
-
Otherwise, the field contains the username used on the remote server.
-
The Interesting events area displays events selected as interesting, for example, a list of commands and window titles from the session that could be interesting from security point of view.
The list of interesting events is currently hard-coded and cannot be modified. For terminal sessions, it includes commands such as:
-
The Network area displays session information, for example:
Details tab
In addition to the Quick look, Interesting events, and Network screen areas, the Details tab also provides monitoring information, audit trail downloads information, and channels information.
If there is a gateway authentication or authorization failure due to an AA plugin, the reason of the failure is displayed in the Deny reason field.
Timeline tab
On the Timeline of the Search interface, for data recorded by SPS, you can do the following:
-
View session events and alerts.
-
Search in the contents of the audit trail.
-
Watch the video of an audit trail from a selected event.
The Timeline tab replaces the now deprecated Events, Alerts, and Contents tabs.
Figure 296: Timeline tab
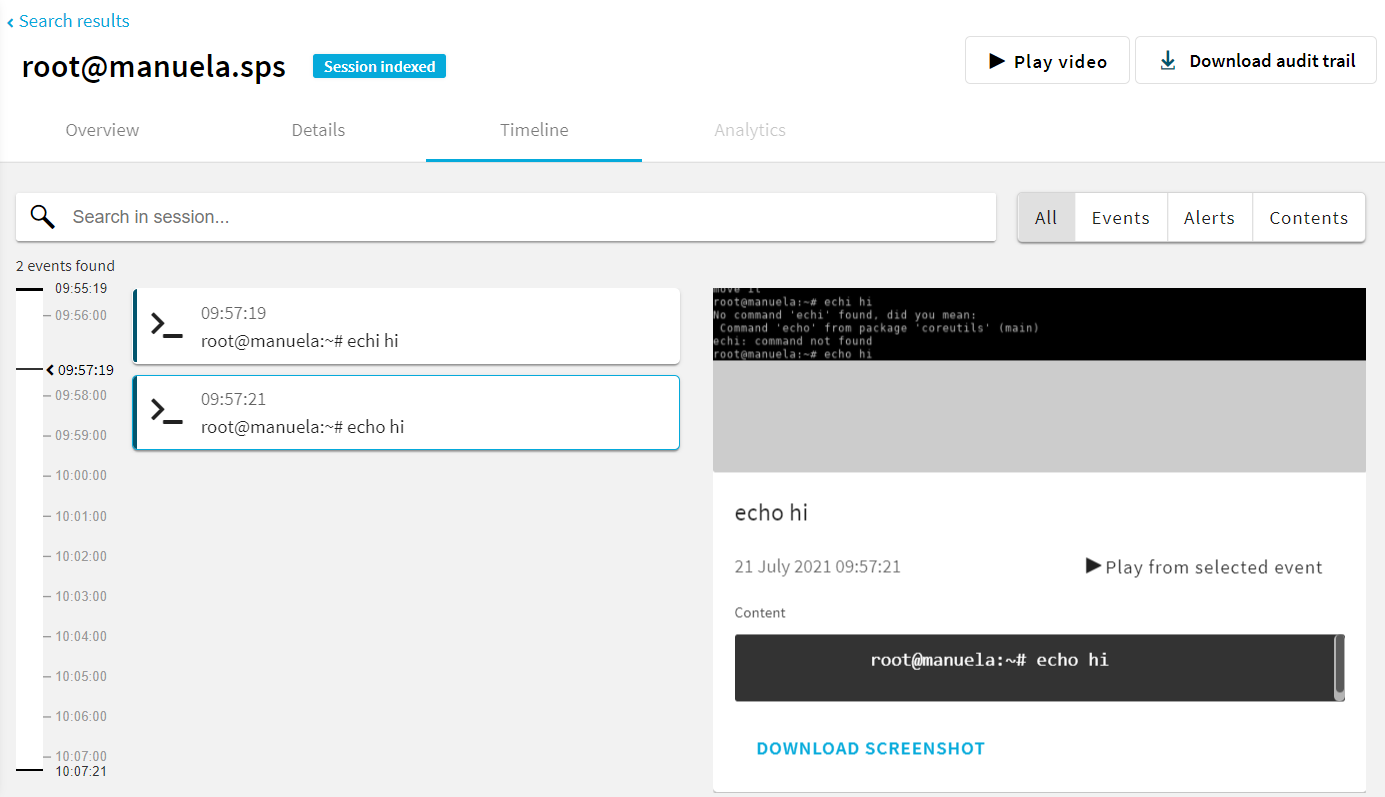
Events:
-
Session events in chronological order.
You can narrow the event list by entering the event name in the Search in session field.
-
Date and time of the event.
-
Event type (command, screen content, and window title).
-
Event details.
-
Screenshots.
Alerts:
-
Content policy alerts triggered in the session, in chronological order.
You can narrow the alert list by entering the alert name in the Search in session field.
-
Date and time of the alert.
-
Alert details.
-
Screenshots.
Contents:
You can search in the contents of the audit trail using plain-text search. Searching using complex keyphrases is not supported from the Timeline tab.
Screenshots:
If screenshots are available for the session, you can click each event or alert to view the corresponding screenshot.
Screenshots are not available for:
-
Ongoing sessions.
-
Unindexed sessions.
-
Trails of HTTP sessions.
-
Encrypted trails (without the necessary certificate).
If screenshots are encrypted, you have to upload the necessary encryption key to your keystore. For more information, see Viewing encrypted screenshots.
Analytics tab
If you use the One Identity Safeguard for Privileged Analytics, you can view detailed analyses provided by the configured algorithms. For more information, see Analyzing data using One Identity Safeguard for Privileged Analytics.
Managing active sessions
For information on how to follow and terminate active sessions, see section Following active sessions.
