From the Search interface, you can view session details for data recorded by SPP. To view session details for data recorded by SPS, see Viewing session details for data recorded by SPS.
If you have linked your SPS to your SPP deployment, the  icon in the Search interface indicates that data was recorded by SPP.
To search only for data recorded by SPP, enter origin:("VAULT") in the Search query field.
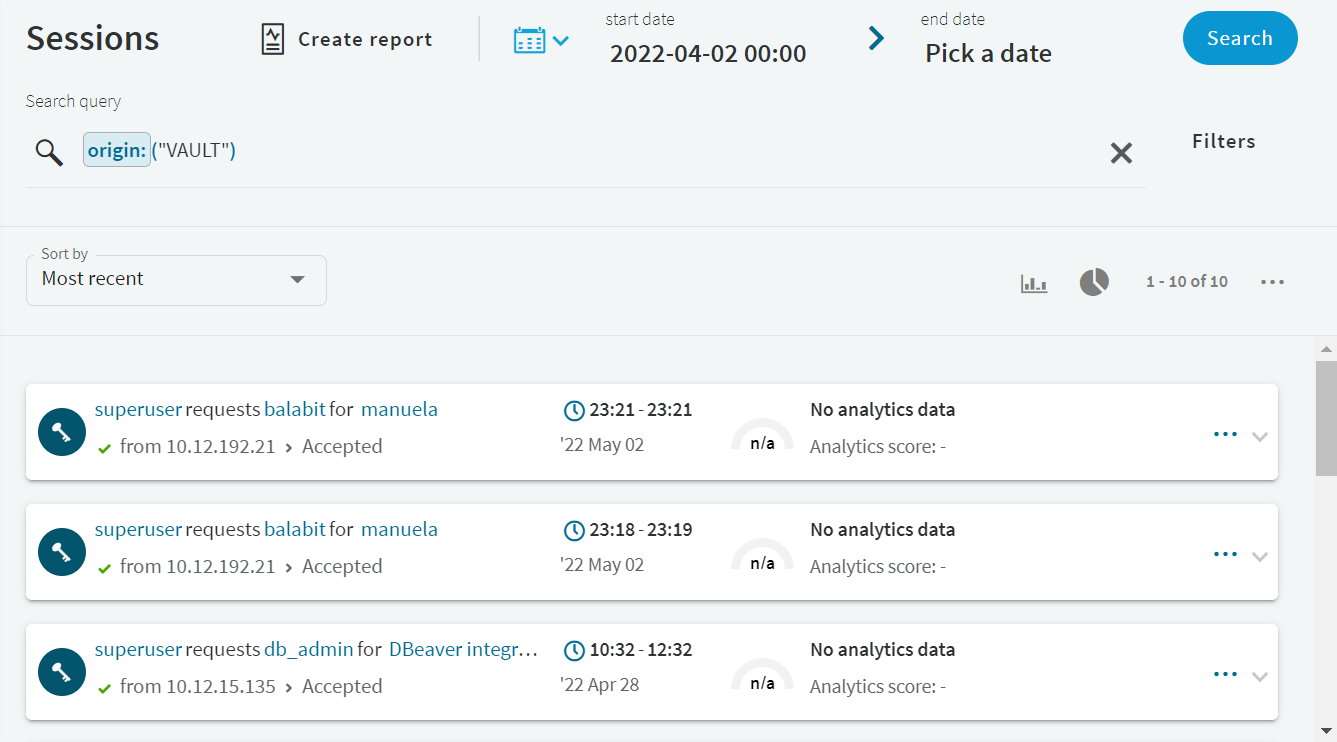
To view session details, click the  button in the last column of the relevant session.
Figure 297: Search — Accessing session details
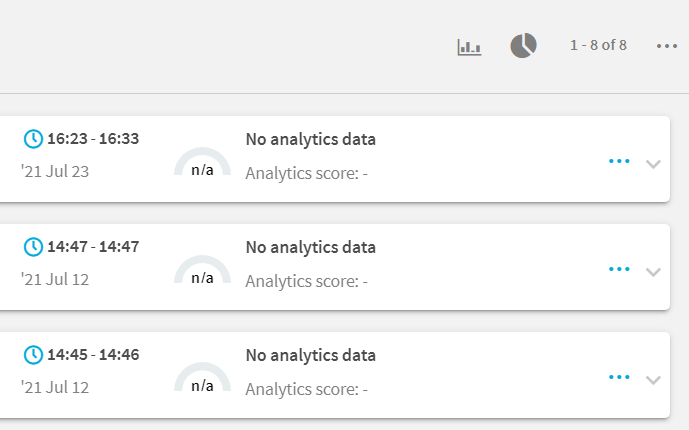
Figure 298: SPP session details
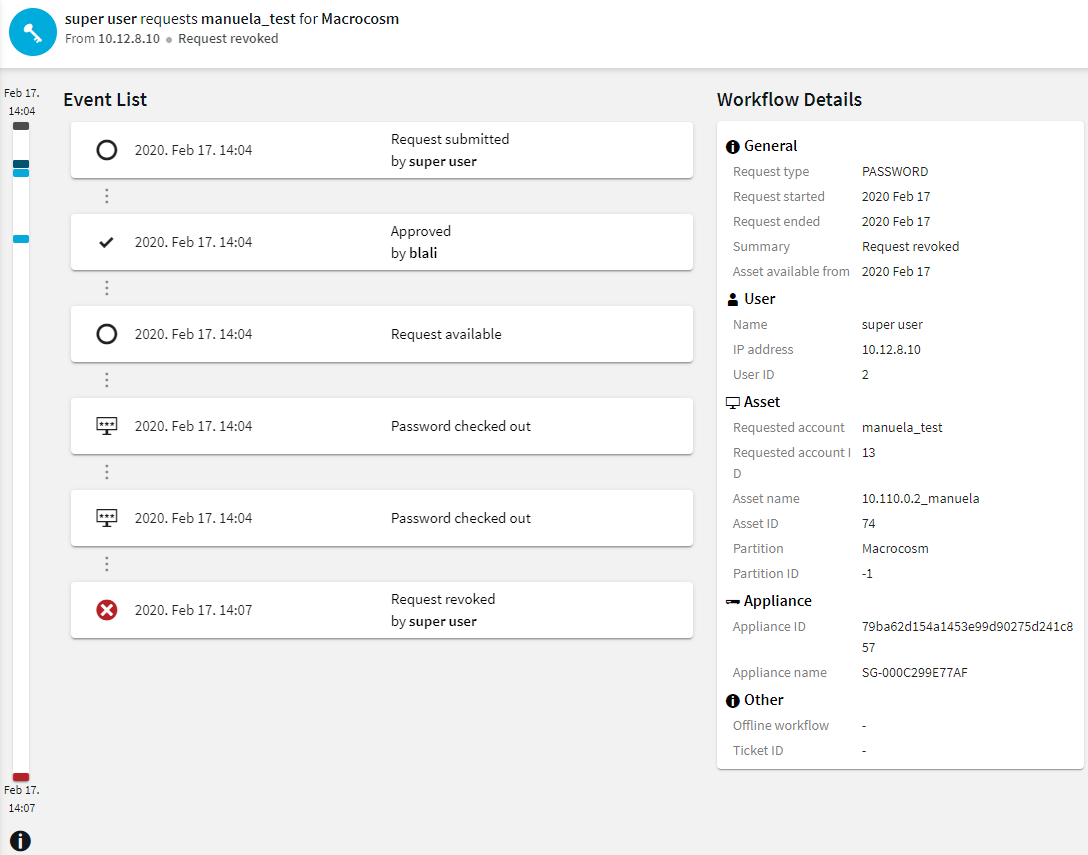
You can display the session details in a timeline. To access the color legend for the timeline, click  (Timeline Color Legend). Hovering your mouse over an event shows the position of that event in the timeline sidebar. It also shows the event as active.
This section provides an overview of the Frequent Item Sets (FIS) flow view feature on the Search interface. It describes the underlying component (that is, the FIS algorithm), the elements of the FIS flow view visual, and possible scenarios (depending on your session details and pattern option choice).
From One Identity Safeguard for Privileged Sessions (SPS) version 6.2., a visual overview of Frequent Item Set (FIS) analysis is available on the Search interface. The FIS flow view is essentially similar to the flow view analytics overview, except that the FIS flow view only displays data narrowed down to a single user's previous sessions in the analysis period (which is the previous 90 days by default).
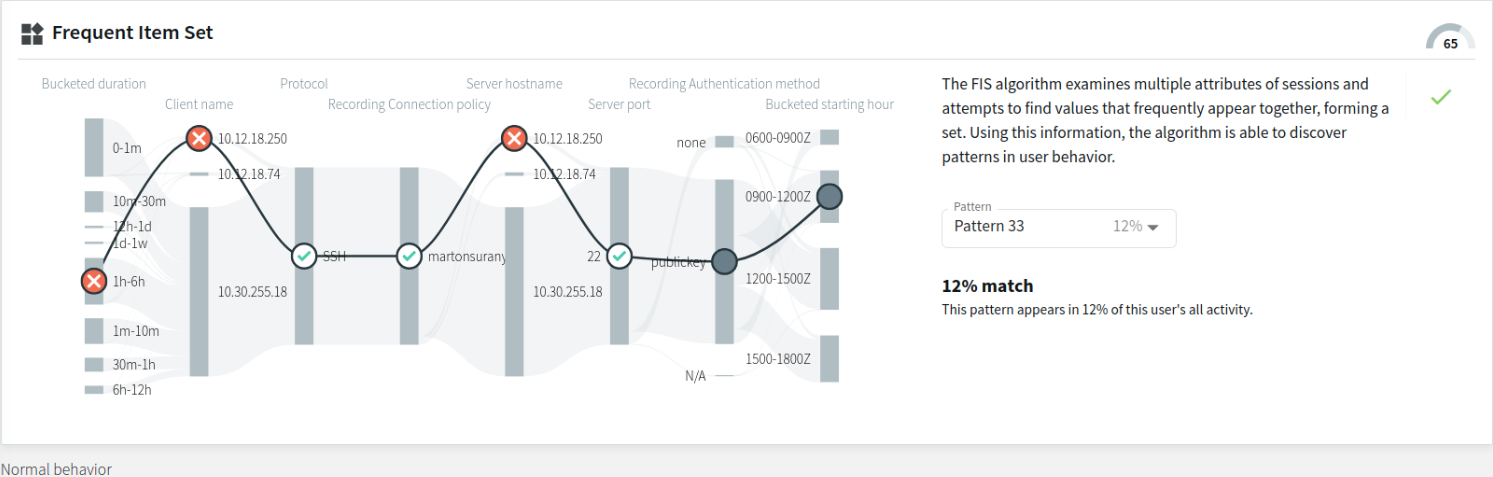
The component behind the analysis is the FIS algorithm, which examines multiple attributes of sessions and attempts to find values that frequently appear together, forming a set. Using this information, the algorithm can discover patterns in user behavior.
NOTE: For the FIS algorithm to be able to score a user's sessions, the user needs at least 1 FIS baseline built. Algorithm baselines (including the FIS baselines) are built automatically every day (usually during hours with less heavy traffic).
Elements of the FIS flow view
To access the FIS flow view feature, click on  of the session of your choice in Search > Sessions list, then click Analytics.
Figure 299: Search — The FIS flow view on the Analytics tab
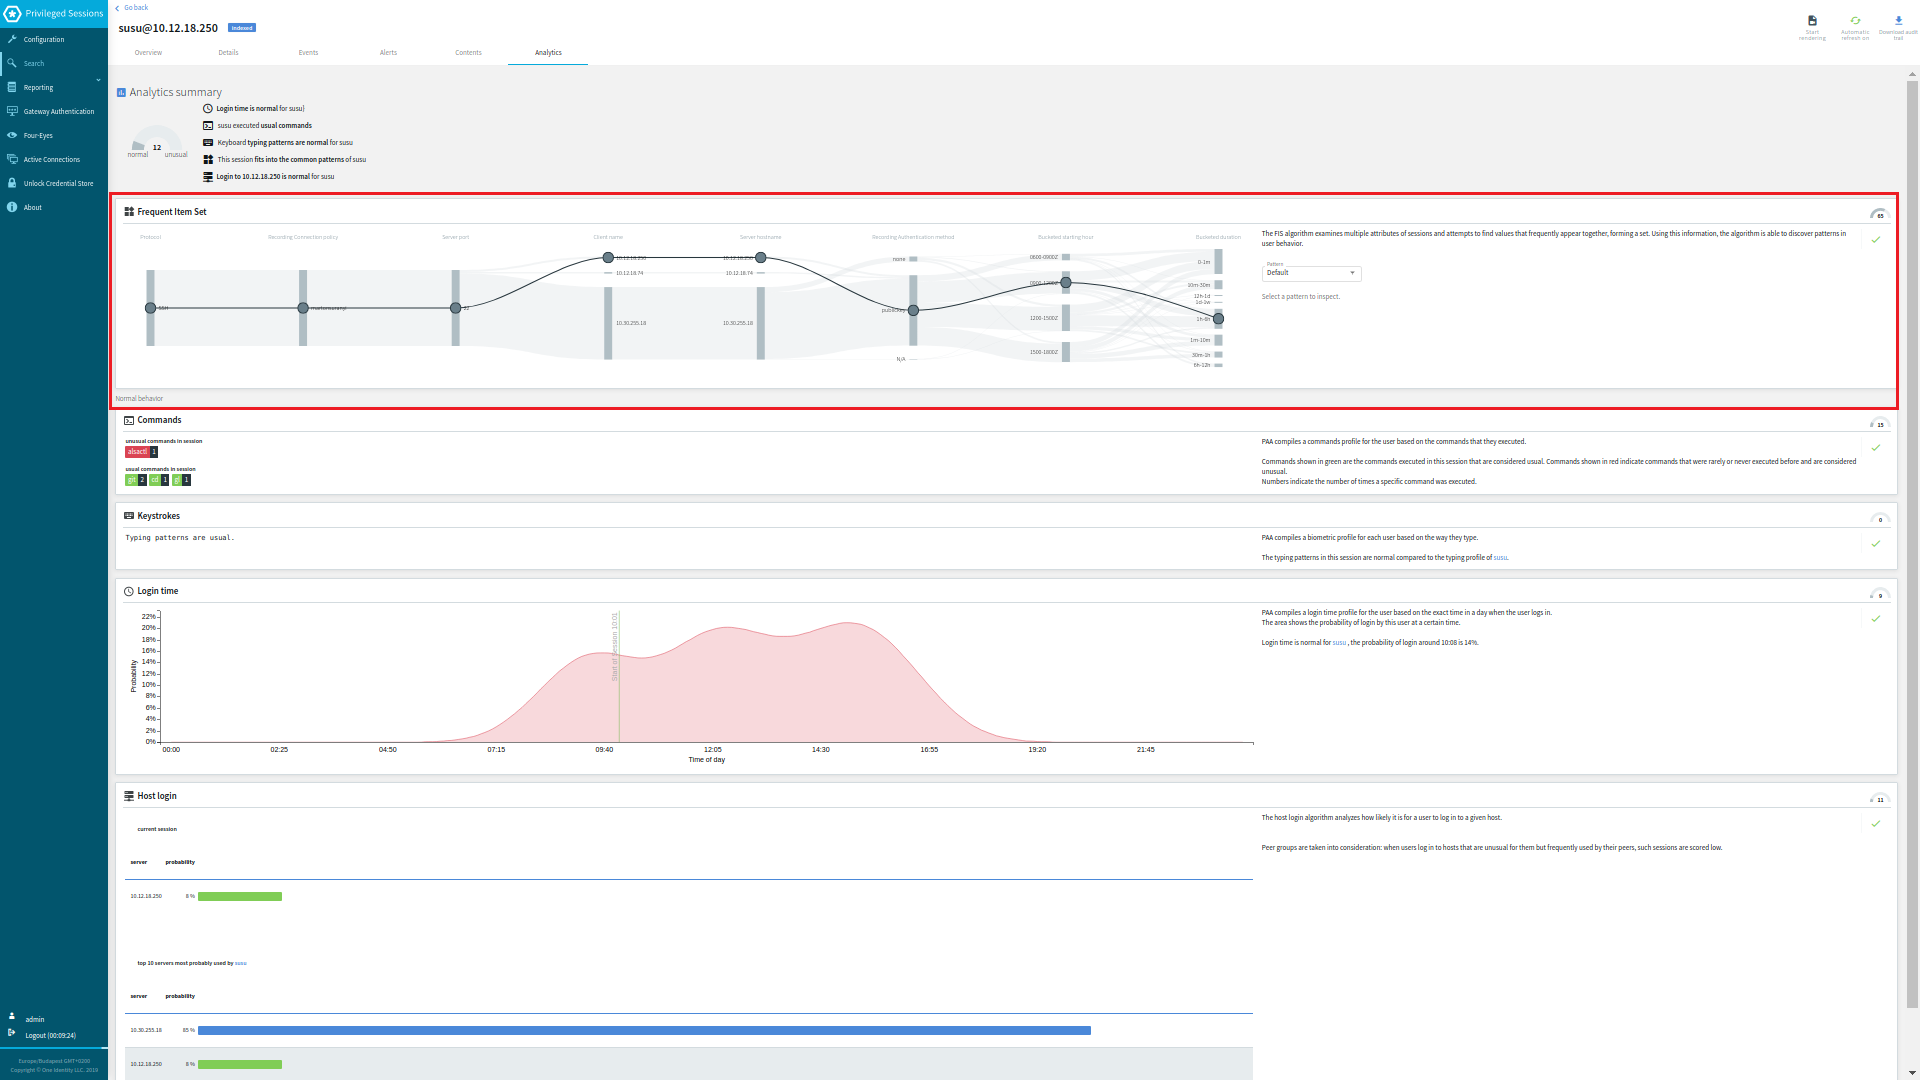
Figure 300: Search — The FIS flow view (close-up)
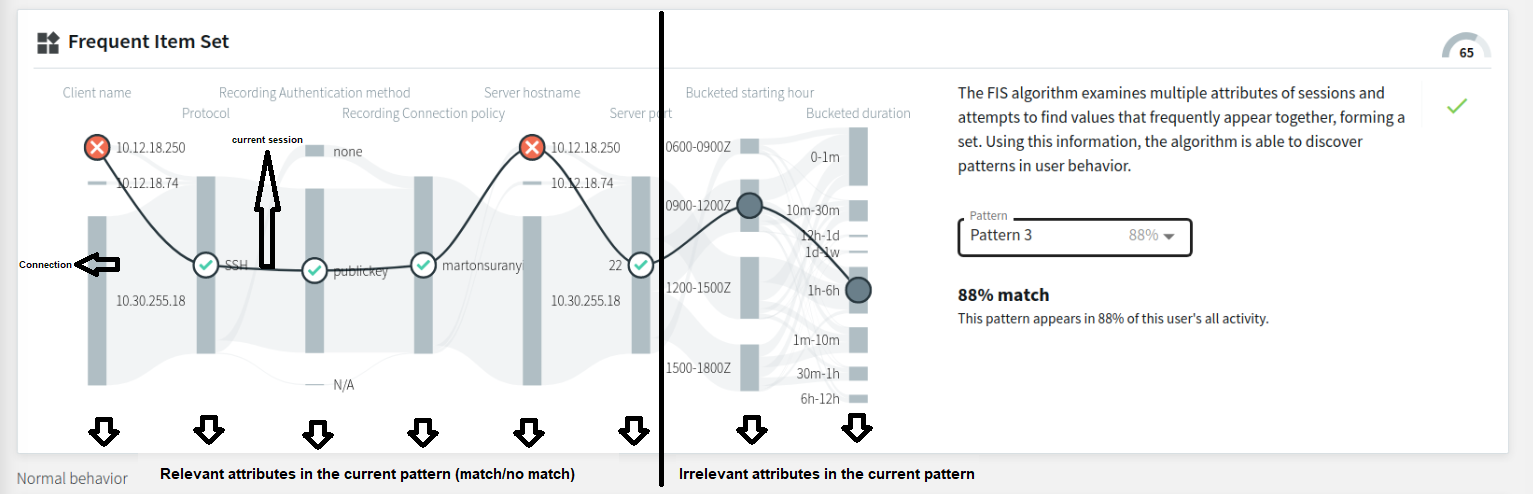
The layout of the FIS flow view is similar to the attributes-grouped flow view, with the sessions forming a flow line (from here on referred to as a Connection). The relevant examined attributes (including the attribute nodes) are visible on the left hand side, while the irrelevant attributes (including the attribute nodes) are on the right hand side of the flow line visual.
The continuous line, with circles representing attribute nodes (that can be gray (  ) or contain the
  or the
  mark), displays the current session. Each attribute node represents that particular attribute's value in the current session. The FIS algorithm attempts to match these attribute values to the patterns in the user's baseline.
The different attribute node markings stand for:
: session data for this attribute is irrelevant for pattern match comparison (or session data is part of the Default option)
: session data for this attribute is a match for the selected pattern
: session data for this attribute is not a match for the selected pattern
Attributes
Similarly to the flow view, session data in the FIS flow view is grouped according to attributes (such as Protocol, Client name, Server hostname, Server port, and so on) that come from session data. The two attributes in the FIS flow view that do not come from session data as-is, but are further grouped instead:
-
Bucketed starting hour: the most frequently used session starting hours grouped into intervals of 3 hours each
-
Bucketed duration: the most frequently occurring session duration values, grouped into intervals of various length
The FIS score gauge
The FIS score gauge (located in the upper right corner of the FIS flow view visual) indicates the FIS score of the selected session.
Figure 301: Search — The FIS score gauge
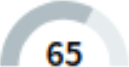
The FIS score is assigned to the session after the FIS algorithm analyzes it in comparison with the latest available baseline. If the session has a high amount of matches to the user's baseline, the FIS score's value will be low (indicating normal user behavior).
The value of the FIS score (also visible on the Search > Sessions list, as well as in the aggregated score summary, usually above the FIS flow line visual) is one of the several components of the session's aggregated score.
Figure 302: Search — The FIS score visible on Search > Sessions list

For more information about analytics algorithms and scores, see this section.
Pattern selection drop-down list
The pattern selection drop-down list (by default set to the Default option) offers the available patterns that the FIS algorithm generates after baseline analysis.
Figure 303: Search — The pattern selection drop-down list (set to the Default option)
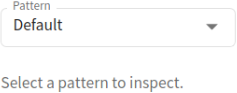
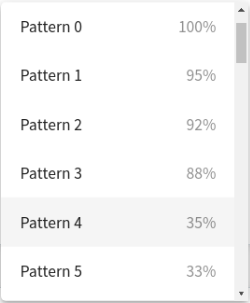
Figure 304: Search — The pattern selection drop-down list (further options)
Depending on which available pattern option you select, the visual will display one of these cases:
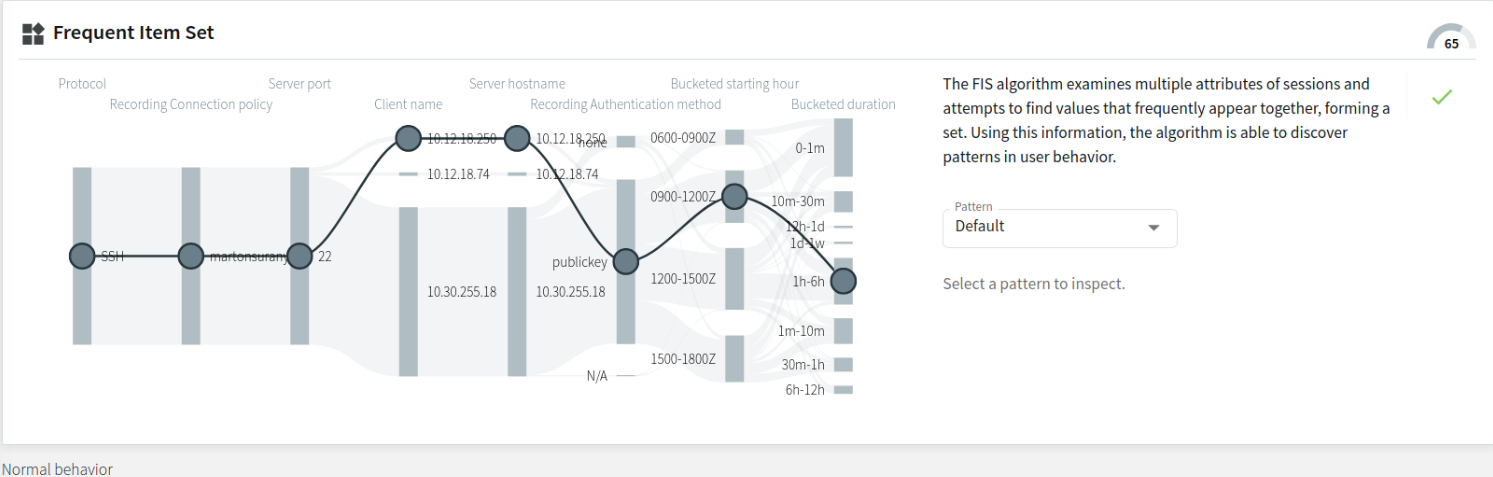
- The Default option
The Default option is the set of values that the FIS algorithm takes as a reference point. If you select the Default option, the flow line visual displays the user's previous sessions in the observed analysis period, with no patterns selected yet. The flow line visual below (set to the Default option) displays all possible attributes, marked with in all attributes.
Figure 305: Search — FIS flow view - the Default option (no patterns displayed yet)
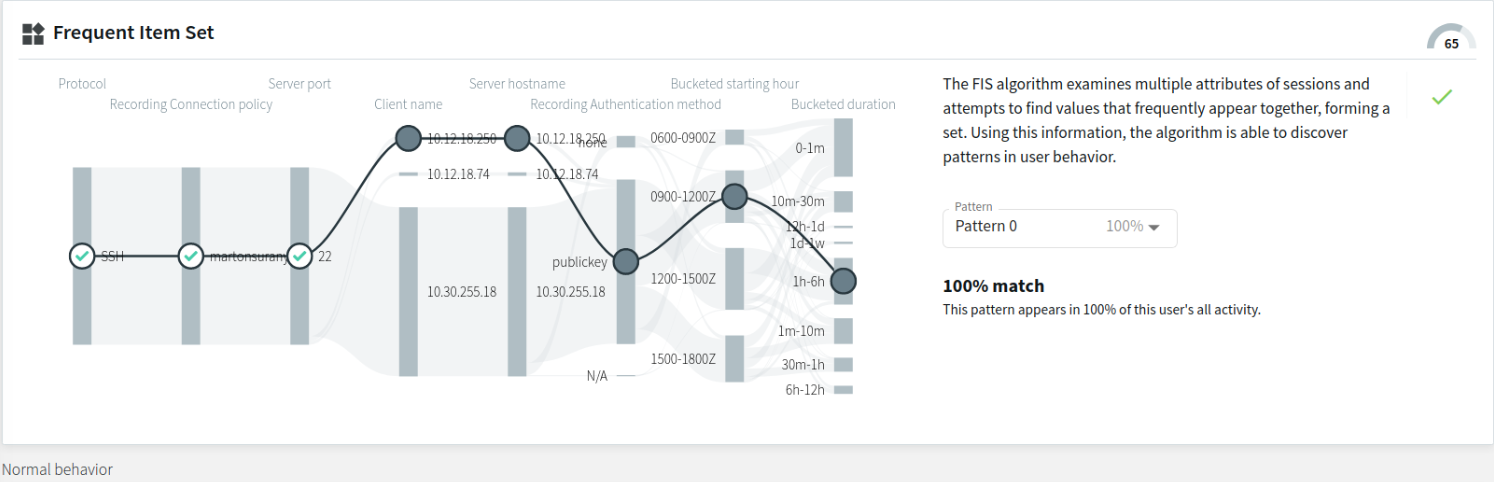
- Pattern with a 100% match to this user's sessions during the observed analysis period
The example below displays a pattern that appears in 100% of the user's previous sessions during the analysis period. As mentioned before, the relevant attribute nodes (marked with the or the sign, depending on whether that attribute value matches or does not match the Default option in that particular session) are arranged on the left-hand side, while the irrelevant ones (marked with ) are arranged on the right-hand side of the flow line visual. There are 3 attribute matches (namely, Protocol, Recording Connection policy, and Server port) to this particular pattern in this particular session.
Figure 306: Search — FIS flow view - a pattern with a 100% match
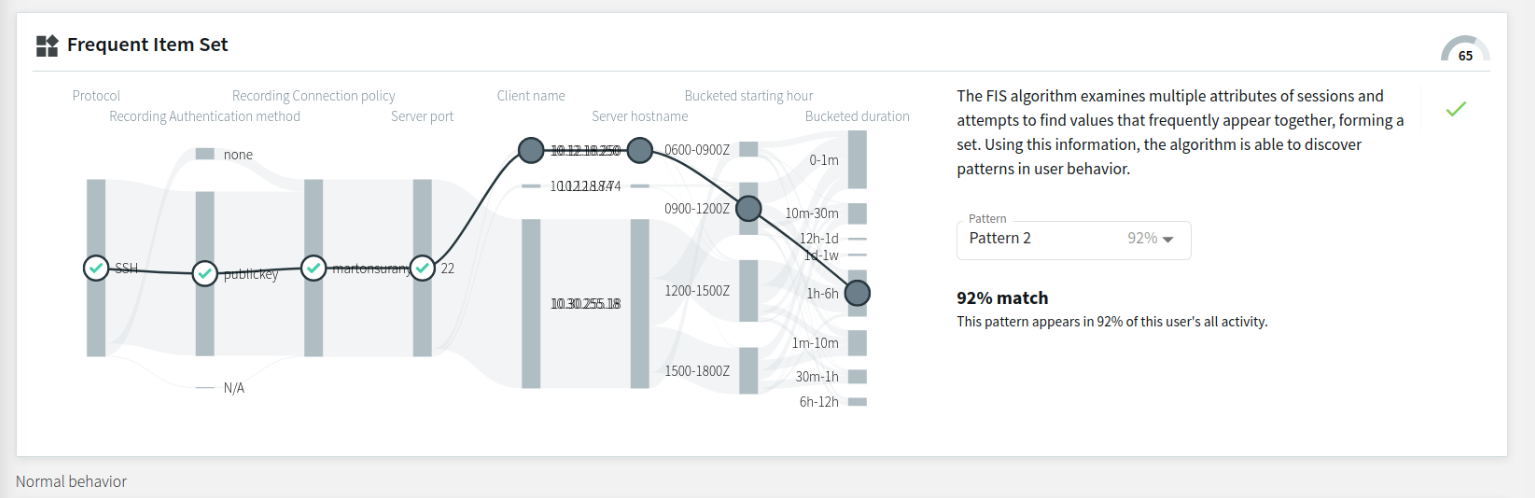
- Pattern with a high match percentage to this user's sessions during the observed analysis period
The example below displays a pattern that appears in 92% of the user's previous sessions during the observed analysis period. Similarly to the previous example, the relevant attribute nodes are arranged on the left-hand side, while the irrelevant ones are arranged on the right-hand side of the flow line visual. This example contains different relevant attribute nodes than the previous example, with 4 attribute matches to this particular pattern in this particular session.
Figure 307: Search — FIS flow view - a pattern with a high match percentage
- Pattern with a low match percentage to this user's sessions during the observed analysis period
The example below displays a pattern with a low match percentage, appearing in only 12% of this user's previous sessions during the observed analysis period. There are 3 attribute nodes that match ( marked with ) and 3 attribute nodes that do not match ( marked with ) this particular pattern in this particular session.
Figure 308: Search — FIS flow view - a pattern with a low match percentage
With the baseline generated every day on average (usually during hours with less heavy traffic), the baseline itself is continuously changing. As a result, the available patterns are also continuously changing over time.
Pattern match percentage
The pattern match percentage is a percentage value displayed under the pattern selection drop-down list, next to the pattern name (for example, Pattern 0 | Pattern 1, and so on).
Figure 309: Search — FIS flow view - the pattern match percentage
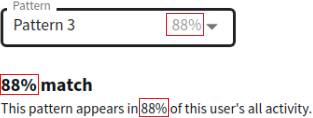
The percentage value always matches the value displayed next to the Pattern options (other than the Default option) in the drop-down list. The percentage indicates to what percent the selected pattern matches this user's sessions during the observed analysis period. Patterns that appear in less than 10% of this user's sessions during the observed analysis period are not displayed in the drop-down list as Pattern options (but may appear in the overall sum of Total count data, as mentioned in Displaying further details of individual Connection segments.
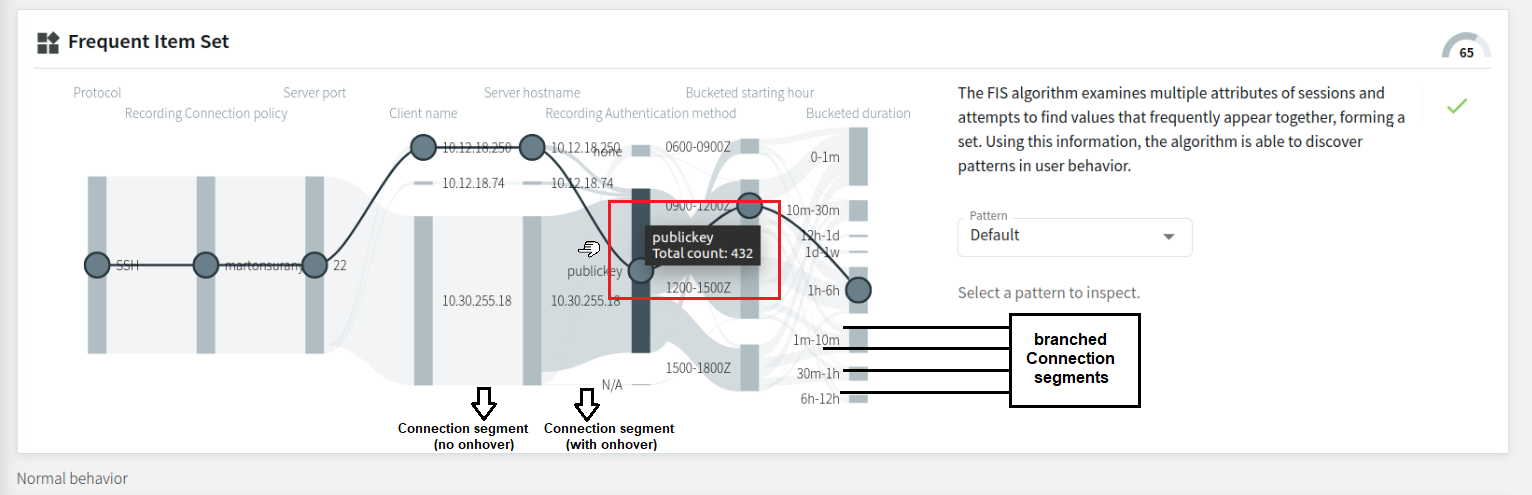
Displaying further details of individual Connection segments
Hovering on an individual Connection segment of the visual displays the exact number of occurrences of that particular attribute value during the observed analysis period. When the Connection splits to several branches (for example, in the example below, the Connection splits into separate branches according to Bucketed starting hour), hovering over the branched Connection segment of your choice will display that particular attribute's further details (namely, the attribute data (for example, IP addresses), and the Total count).
NOTE: The Total count values include session data originating from patterns that appear in less than 10% of the user's sessions during the observed analysis period.
Figure 310: Search — Hovering on particular Connection segments to display further details
This section provides information on how to use the browser to play video files of recorded audit trails, or how to follow active sessions.
Figure 312: Replaying audit trails or following active sessions in your browser
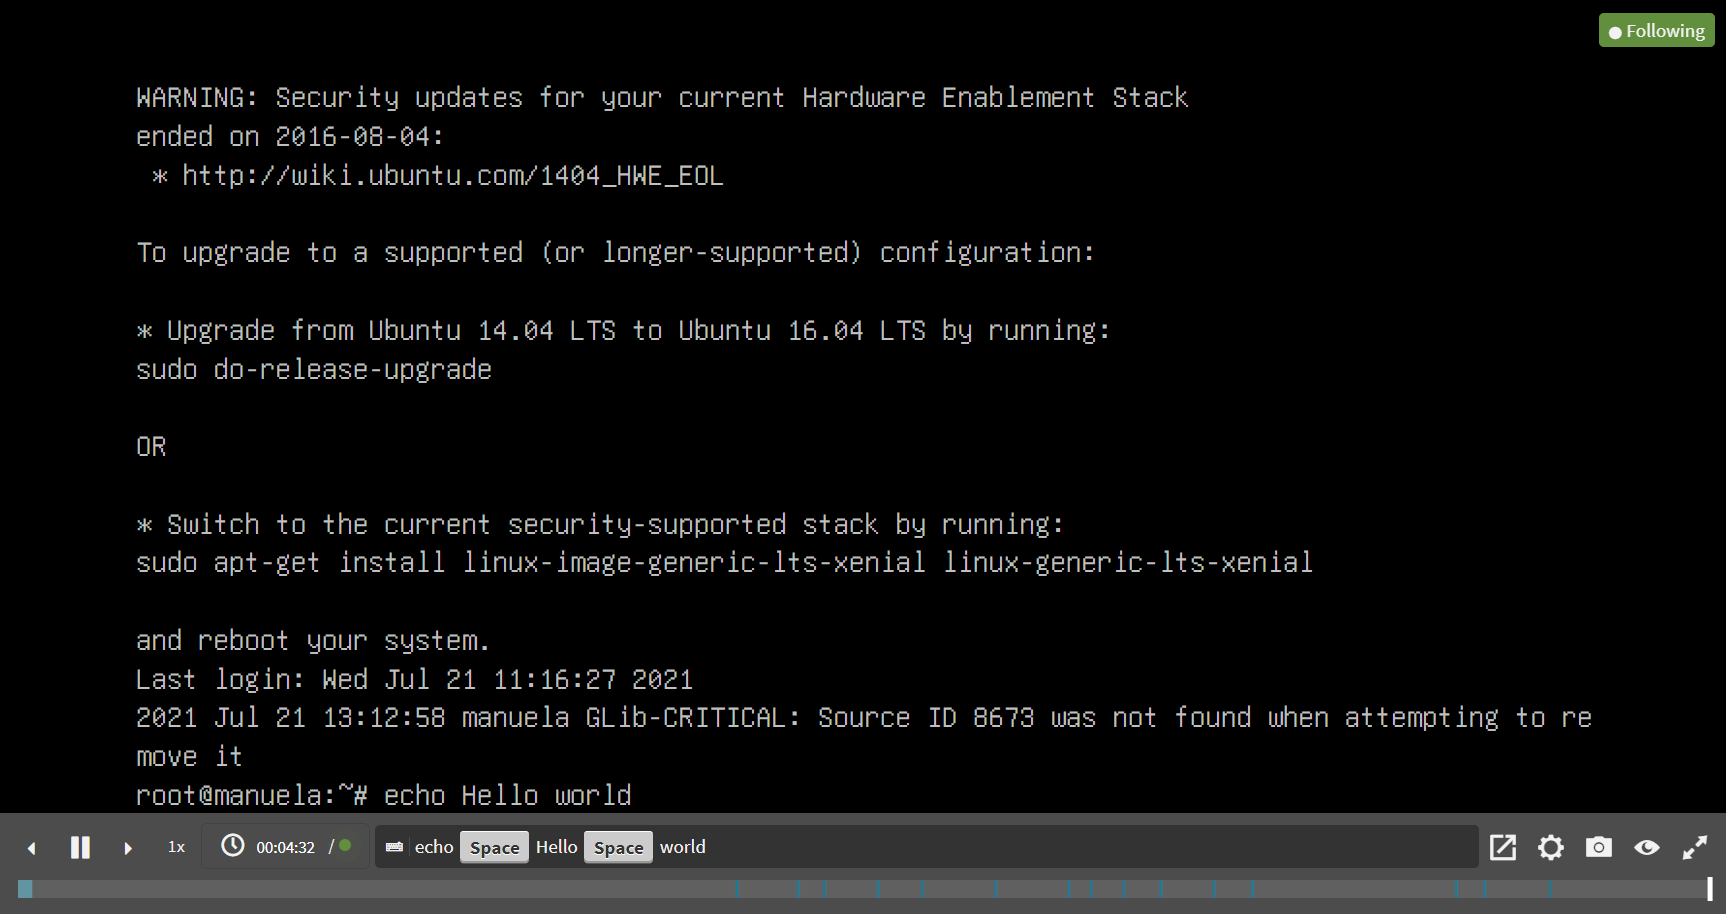
Following active sessions
If you are following an active session, a green Following label is displayed in the top-right corner of the screen, and there is a green, pulsing dot on the menu bar. If you stop following the session, for example, by jumping back in the video, a green Follow button is displayed on the menu bar, which allows you to continue to follow the active session. If a session is not active anymore, the Following label and the green dot are not displayed.
Player window controls
TIP: You can quickly zoom in or out by clicking anywhere in the Player window.
NOTE: From the video, you can copy the content of text-based protocols to the clipboard:
-
Select the required content.
-
Right click on the selected content.
-
From the list of available options, select Copy.
The Player window has the following controls:
-
 ,
,  : Play, Pause.
-
 ,
, : Jump to previous event, Jump to next event.
If you use the button, the video playing is stopped so that you can jump back to preceding events.
-
 : Adjust replay speed. The possible increments are: 0,25, 0,5, 1, 1,5, 2, 3, and 5.
-
Time-related information and options of audit trails:
-
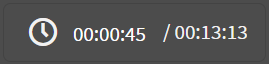 : Time since the audit trail started / Length of the audit trail.
-
To jump to a timestamp in the video, click on the time.
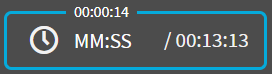 : Time since the audit trail started (top) / Jump to a timestamp (left) / Length of the audit trail (right).
-
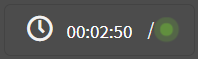 : Time since the audit trail started when following an active session.
-
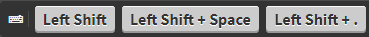 : List of keyboard events. Special characters like SHIFT, ENTER, F1, and so on, and mouse usage are displayed as buttons. If the upstream traffic is encrypted, upload your permanent or temporary keys to User menu > Audit keystore to display the keyboard events. This will not be displayed if your upstream traffic is encrypted but not unlocked.
-
 : Share. You can copy the link of a session, or optionally, obtain the link of a session starting from a specific timestamp.
-
 : Encoding settings. This option enables you to set the encoding for terminal-based and graphical protocols.
For terminal-based protocols, you can set the following:
-
Terminal encoding layout
-
Telnet codec
-
Telnet alternate codec
For graphical protocols, you can set the keyboard layout.
You can save your video encoding settings, which are stored locally, in your browser.
-
 : Create a screenshot.
-
 : Show / hide events. Select the types of events to display. The available options are Keystroke, Mouse activity, and On-screen changes. Depending on the protocol used and how the audit trail was processed, SPS can display keyboard events, commands, mouse events, and window titles. Commands and window titles are displayed as subtitles at the bottom of the screen. This will not be displayed if your upstream traffic is encrypted but not unlocked.
-
 ,
,  : Switching fullscreen mode on and off
-
 : Progress bar and distribution of events. Light blue - screen change, blue - keyboard or mouse event, dark blue - command or title event. This will not be displayed if your upstream traffic is encrypted but not unlocked.
-
 : Close the player, and return to the Connection details page.


 .
.