View the details of a session.
To view details of a session, click 
View session analytics.
Click the Analytics tab.
The top of the page displays a summary of key insights about the session, such as:
-
The aggregated score (indicated by a gauge). The following color codes are used:
-
Scores between 80-100 indicate unusual behavior, their color code is red.
-
Scores between 70-79 indicate behavior that might require further analysis and attention, their color code is amber.
-
Scores between 0-69 indicate normal behavior, their color code is gray.
-
-
A one-sentence summary of each algorithm's verdict about the session and user behavior.
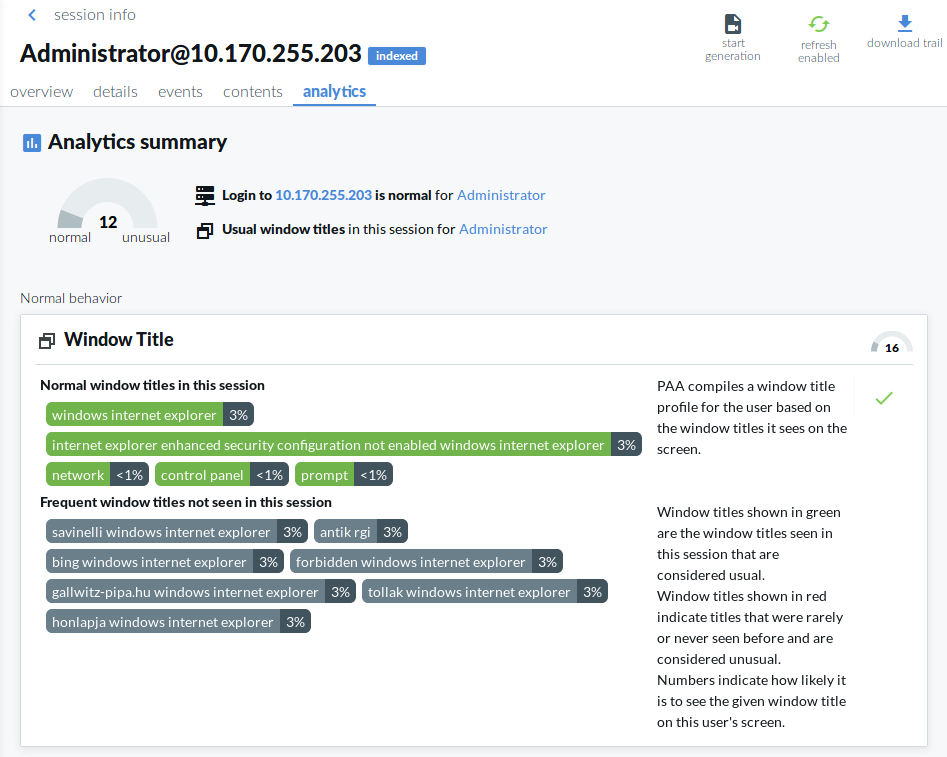
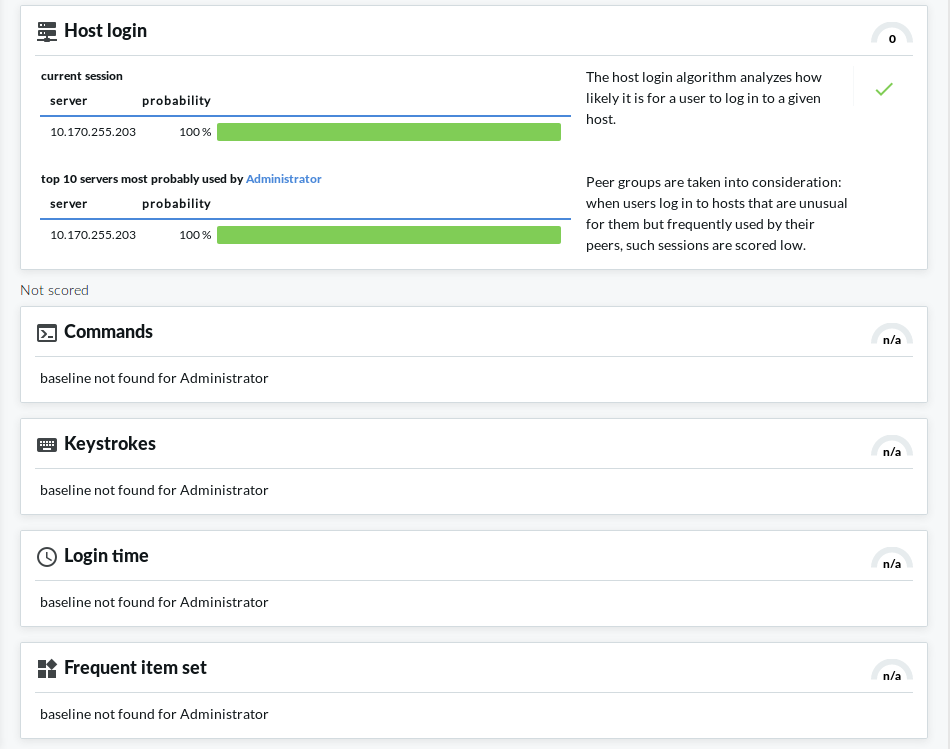
The Anomalies found and Normal behavior sections of the page display detailed analyses provided by each of the configured algorithms. This includes short information on how a particular algorithm works and how to read the visualized insight, as well as scores given by the individual algorithms.
Figure 401: Search — Viewing details on the Analytics tab: Anomalies found
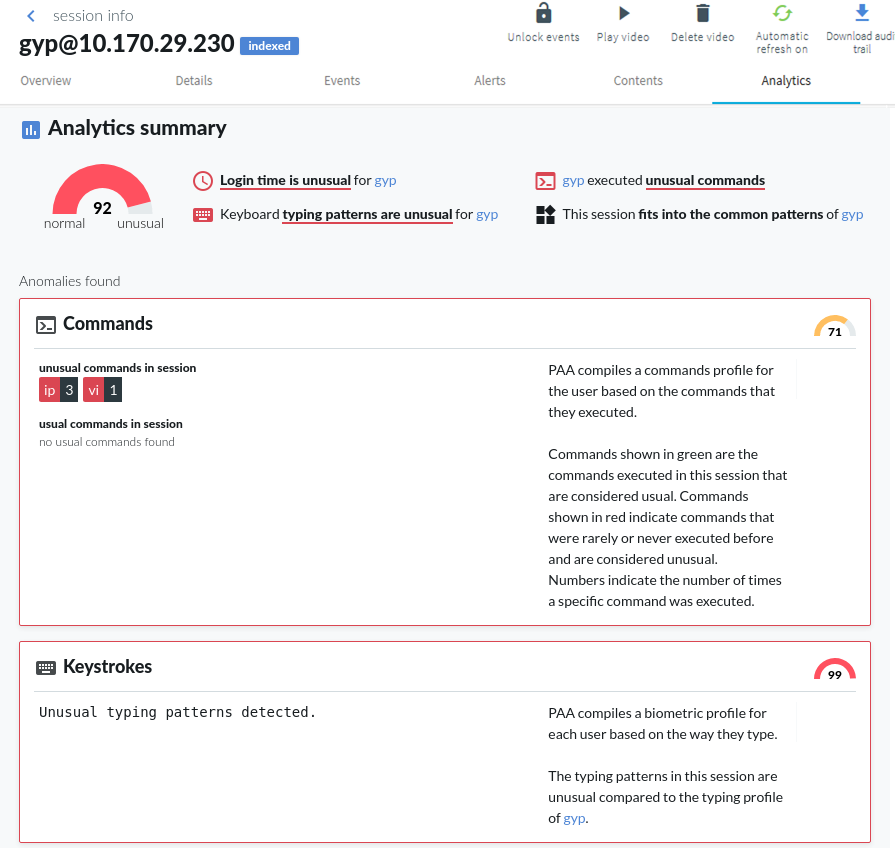
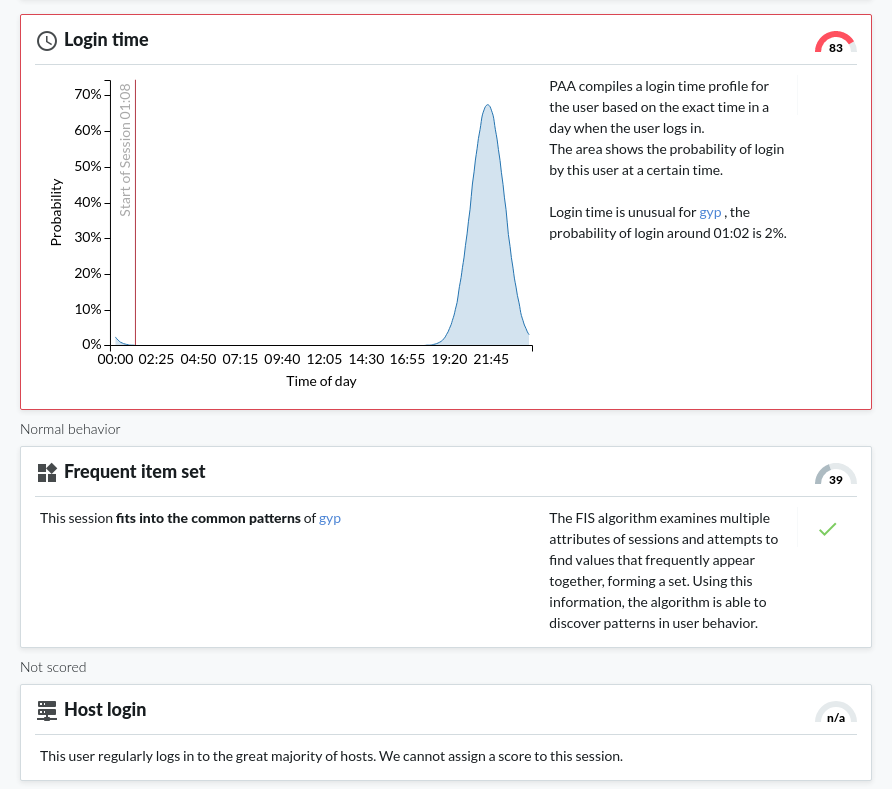
Figure 402: Search — Viewing details on the Analytics tab: Normal behavior