To display statistics about the log messages, click the  icon in the appropriate header of the table.
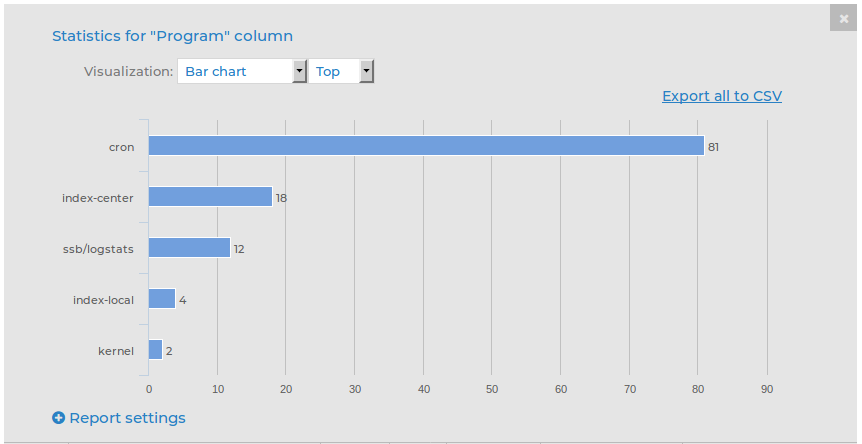
You can choose from Bar chart or Pie chart & List.
NOTE: For performance reasons, when creating statistics for a Multiple Logspace (see Creating multiple logspaces in the Administration Guide), syslog-ng Store Box(SSB) does not create statistics if the data upon which the statistics is based (for example, the hostname) has over 1000 entries in any of the member logspaces. In this case, SSB displays the Number of member statistics has too many entries error message.
Figure 223: Search > Logspaces — Displaying log statistics as Bar chart
In Pie chart & List view, percentages add up to 100%. The only exception to this is when statistics are based on Tags. Since statistics are provided for tags rather than messages, when messages have multiple tags, the percentages may add up to more than 100%.
Figure 224: Search > Logspaces — Displaying log statistics as Pie chart & List
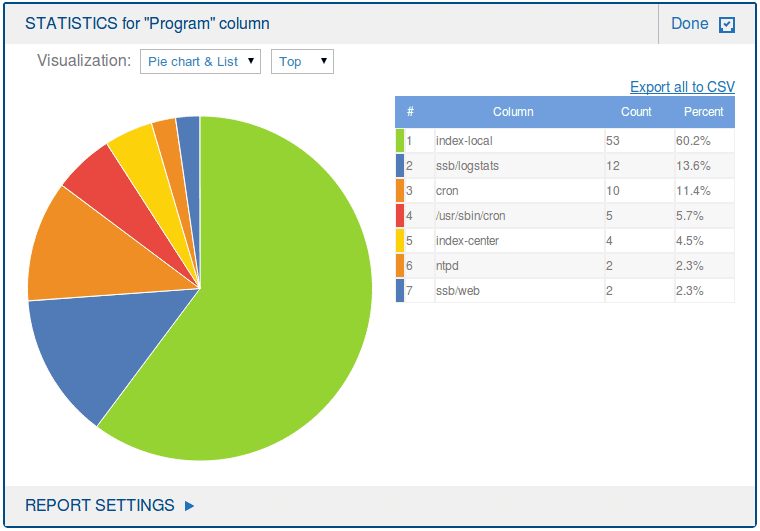
Statistics will show the item with the largest number of entries first. To display the item with the least number of entries first, select Least.
NOTE: When navigating to a future time in the search bar, the number of logs displayed in the Search results may differ from the number of logs displayed in the Count part of the Host pie chart.
To avoid this, do not navigate to a future time.
If this has already happened, save the search expression that you have used elsewhere, then refresh the page by clicking Log > Search again. Consider that it will display the original state of the Search page, meaning that, for example, it will remove all search expressions that you have entered before.
You can export these statistics in CSV format using the Export all to CSV option, or you can include them in reports as a subchapter.
|

|
Caution:
Do not use Export all to CSV to export large amounts of data, as exporting data can be very slow, especially if the system is under heavy load. If you regularly need a large portion of your data in plain text format, consider using the syslog-ng Store Box(SSB) RPC API (for details, see The SSB RPC API in the Administration Guide), or sharing the log files on the network and processing them with external tools (for details, see Accessing log files across the network in the Administration Guide). |
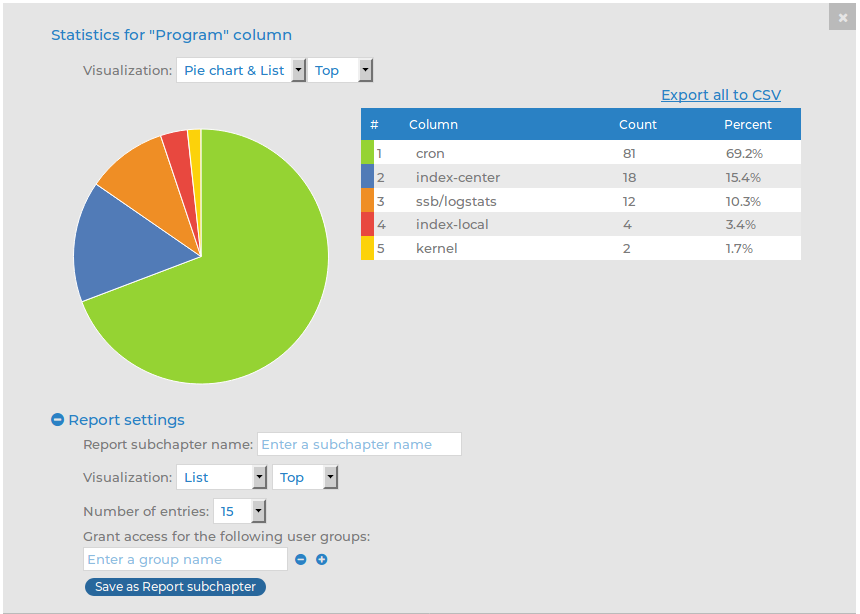
You can save log statistics to include them in reports as a subchapter.
Figure 225: Search > Logspaces — Creating reports from custom log statistics
-
In the Statistics view, click Report settings.
-
Add a name for the statistics in the Report subchapter name field.
-
Select the Visualization for the report: List, Pie chart, or Bar chart.
-
Choose how the entries are sorted: descending (Top) or ascending (Least).
-
Choose the Number of entries to include.
NOTE: Selecting All includes only the first 1000 results. The remaining results are aggregated as 'others'.
NOTE: For performance reasons, when creating statistics for a Multiple Logspace (see Creating multiple logspaces in the Administration Guide), syslog-ng Store Box(SSB) does not create statistics if the data upon which the statistics is based (for example, the hostname) has over 1000 entries in any of the member logspaces. In this case, SSB displays the Number of member statistics has too many entries error message.
-
Select the user group that can access the subchapter in the Grant access for the following user groups field.
-
Click Save as Report subchapter.
-
To add the saved subchapter to a report, follow the instructions provided in Configuring custom reports.
The syslog-ng Store Box(SSB) appliance can create content-based alerts about log messages based on specific search expressions. Search queries are run every few seconds and an alert is triggered whenever a match between the contents of a log message and a search expression is found. Alerts are collected and sent to a pre-defined email address (or email addresses).
Some log messages might have particular significance and therefore getting notifications about those can often be more efficient than searching for them manually.
You can set up or modify alerts for local logspaces or those logspaces to which you have the relevant privileges, meaning that:
-
Either the relevant user group has been assigned read and write/perform access to the Search > Logs object on the AAA > Access Control page.
-
Or the user group has been added under the Access control option of the relevant logspace on the Log > Logspaces page.
You can create alerts either by using the search interface or the Search > Content-Based Alerts page:
NOTE: Content-based alerting is currently not available for filtered, multiple, and remote logspaces.
NOTE: In the case of encrypted logspaces, no decryption key is required for content-based alerting to work. SSB has access to the log messages while processing them, and the indexer and content-based alerting services run before encryption happens.
This section describes how to set up alerts using the search interface.
To set up alerts using the search interface
-
Configure a target where you wish to send your content-based alerts.
Alert targets are set up and modified by superusers or user groups that have been assigned read and write/perform access to the Policies object on the AAA > Access Control page.
To specify an alert target:
-
Go to Policies > Alert targets.
-
Click  .
.
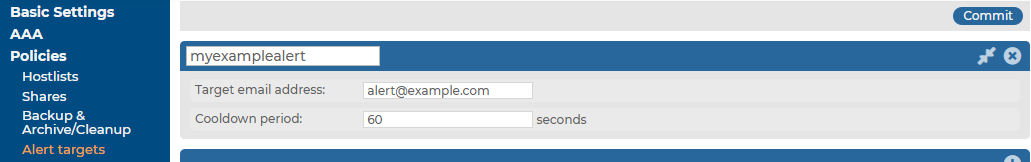
The new tab that opens allows you to record an alert target.
Figure 226: Policies > Alert targets — Alert targets page
-
Enter a name for your alert target.
NOTE: Alert target names must be unique.
-
In the Target email address field, enter the email address where you wish to send alerts.
NOTE: You can specify only one email address per target. However, you can add multiple targets per alert, which allows you to send a specific alert to more than one email addresses (if required).
-
In the Cooldown period field, enter the minimum amount of time (in seconds) that should pass between the sending of two alert messages to this target.
The minimum value is 60 seconds, and the maximum value is 999999 seconds.
NOTE: An alert message is sent only when a match is found between the contents of log messages and a search expression. This means that if no match is found, more time may pass between two alert messages than the interval specified as the cooldown period.
-
Click  to save your details.
Expected result:
You have successfully configured a target for your alert where alert messages will be sent.
-
(Optional) You can also specify the email address from which the alerts are sent to your targets. Configuring an email address from where you wish to receive emails can be useful for filtering purposes. If you do not specify such an email address, a default address will be used.
For detailed instructions, see the steps describing how to specify a Send emails as email address in Configuring email alerts in the Administration Guide.
-
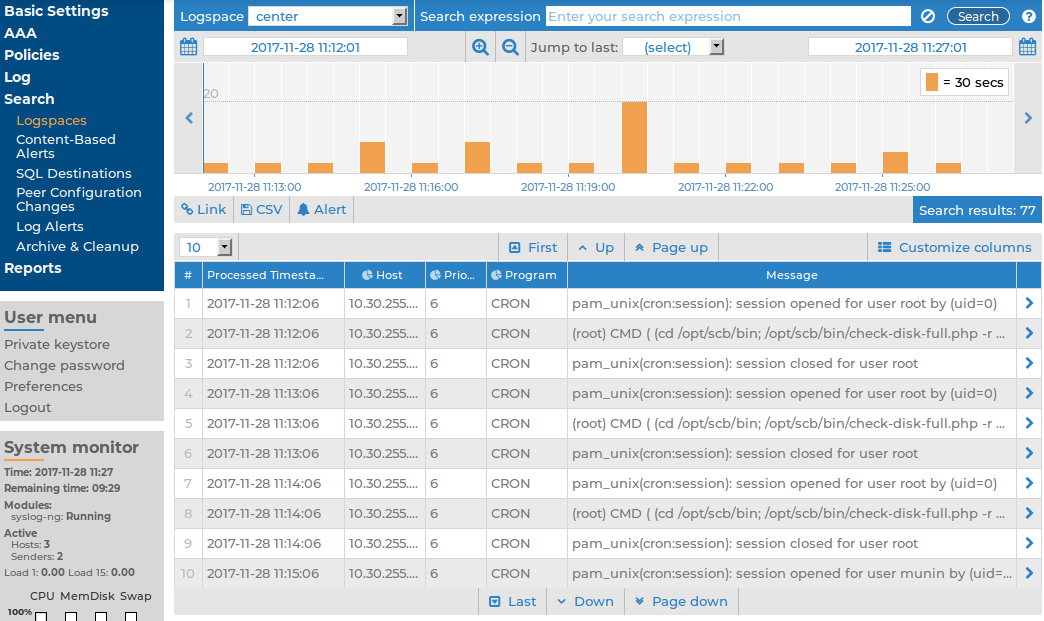
Once you have set up a target or targets, navigate to the search interface by going to Search > Logspaces.
Figure 227: Search > Logspaces — Setting up alerts on the search interface
-
In the Logspace name menu, select the relevant logspace.
-
In the Search expression field, enter the search expression that you wish to receive alerts about and click  .
.
-
To configure additional details for the alert, click  . The Content-based alerting panel is displayed.
Figure 228: Search > Logspaces — Content-based alerting panel
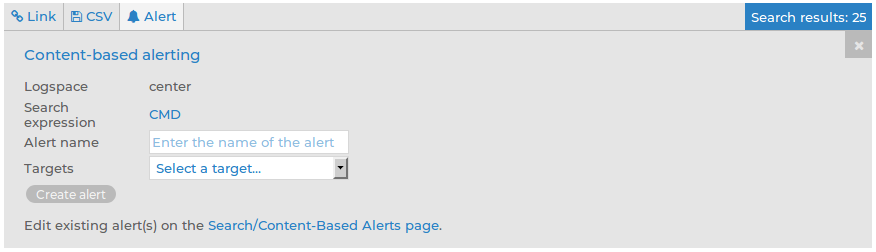
The Logspace field displays the name of the logspace that you have selected from the Logspace name menu. The Search expression field displays the search expression that you entered in the Search expression field.
-
Enter a name for your alert in the Alert name field.
NOTE: Alert names must be globally unique. Using a prefix before alert names can help avoid specifying a name that is already in use.
-
Select a target from Targets. You can select multiple targets if you wish to distribute the alert to multiple email addresses.
You can remove targets you have already added by clicking  (Delete target) in front of the target's name.
-
To save your details, click  .
.
