Status history and statistics
The syslog-ng Store Box (SSB) appliance displays various statistics and the status history of system data and performance on the dashboard at Basic Settings > Dashboard. The dashboard is essentially an extension of the system monitor: the system monitor displays only the current values, while the dashboard creates graphs and statistics of the system parameters.
The dashboard consists of different modules. Every module displays the history of a system parameter for the current day. To display the graph for a longer period (last week, last month, or last year), select the Week, Month, or Year options, respectively. Hovering the mouse over a module enlarges the graph and displays the color code used on the graph.
To display the statistics of a module as a table for the selected period, click on the graph.
Figure 235: Basic Settings > Dashboard — The dashboard
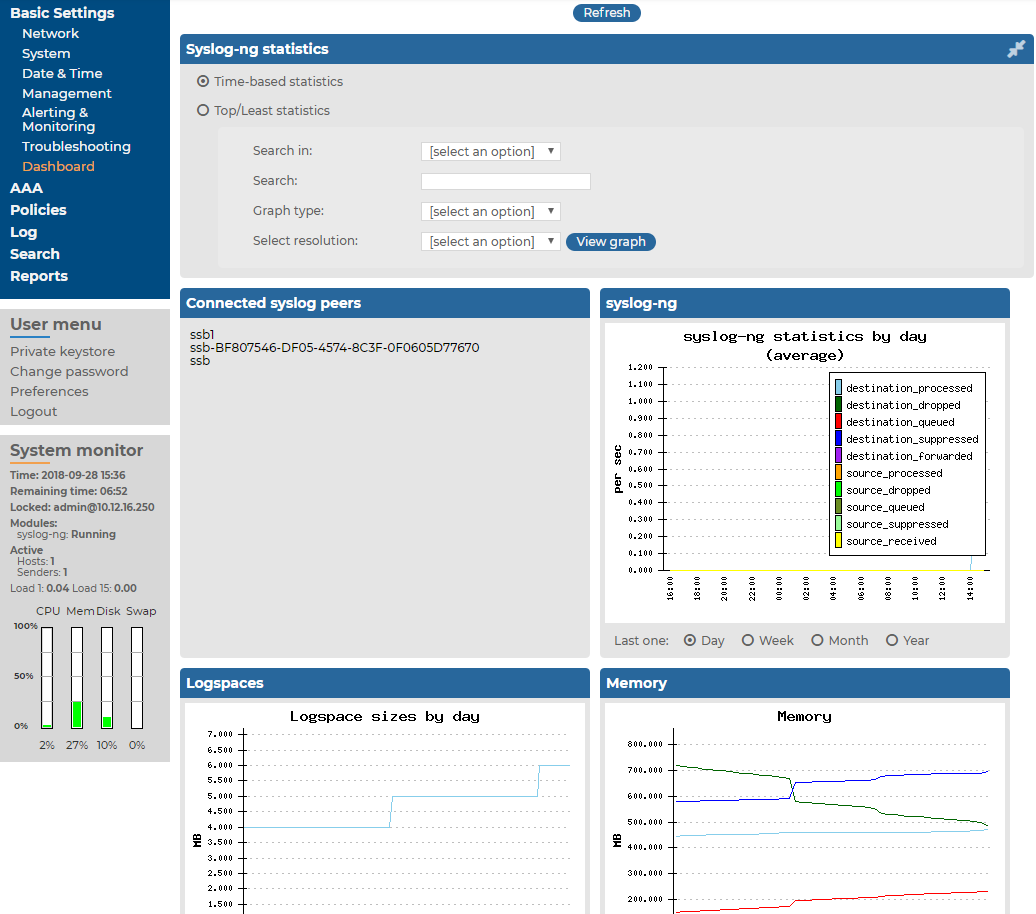
The following modules are displayed on the dashboard of SSB:
|

|
Caution:
Statistics about syslog-ng and logspace sizes are not backed up. As a result, following a data restore, the Basic Settings > Dashboard page will not show any syslog-ng and logspace statistics about the period before the backup. |
-
syslog-ng: syslog-ng statistics about the received, processed, and dropped messages. See also Displaying custom syslog-ng statistics.
-
Connected syslog peers: A list of hosts that actively send messages to SSB. Note that these values are updated periodically based on the Sampling interval set on page Log > Options > Dashboard Statistics. For details, see Displaying custom syslog-ng statistics.
-
syslog-ng statistics: The rate of incoming messages in messages/second. Note that the values displayed are average values calculated for the last 15 minutes.
-
Logspaces: The size of the logspaces. Note that these values are updated only every ten minutes.
-
Memory: The memory used by the system.
-
Disk: Filesystem usage for the different partitions.
-
CPU: CPU usage.
-
Network connections: The number of network connections.
-
External interface: Traffic on the external interface.
-
Management interface: Traffic on the management interface.
-
Load average: Average load of the system.
-
Processes: The number of running processes.
For details about setting the statistics collection options, see Statistics collection options.
Displaying custom syslog-ng statistics
The following describes how to display statistics of a specific source, destination, or host.
To display statistics of a specific source, destination, or host
-
Navigate to Basic Settings > Dashboard > syslog-ng statistics.
-
-
To display the statistics of a particular source, select source from the Search in field, and enter the name of the source into the Search field. Source names all start with the s character.
-
To display the statistics of a particular destination, select destination from the Search in field, and enter the name of the destination into the Search field. Destination names all start with the d character.
-
To display the statistics of a particular host, select src.host from the Search in field, and enter the hostname or IP address of the host into the Search field.
-
Select the time period to display from the Select resolution field.
-
Click View graph.
Statistics collection options
To control the quantity and quality of the statistics collected to the Dashboard, set the statistics collection options.
Navigate to Log > Options > Dashboard statistics.
Time-based statistics: The default setting is Enabled.
-
Cleanup if unchanged for: Statistics unchanged (not present in syslog-ng statistics output anymore) for this number of days will be cleaned up from the system. Enter 0 here to keep them forever. To start the cleanup process immediately, click Cleanup now.
-
Enable statistics for: The default setting is that all checkboxes are enabled. This allows you to select which options to collect statistics for. To display the collected statistics for an option, navigate to Basic Settings > Dashboard > Syslog-ng statistics, select Time-based statistics and select the desired option.
NOTE: When disabling an option, the data will only be deleted after the first cleanup. Until then, the data already collected is still accessible on the dashboard.
Top/Least statistics: The default setting is Enabled and all checkboxes are enabled. This allows you to select which options to collect statistics for. To display the collected statistics for an option, navigate to Basic Settings > Dashboard > Syslog-ng statistics, select Top/Least statistics and select the desired option.
Maximum number of statistics to process: Enter the number of statistics files to keep on the system. Enter 0 here to store unlimited number of statistics files. Statistics over this limit will be dropped, and SSB sends an error message containing the number of entries dropped and the first dropped entry. This setting needs to be increased only if you have more than 10000 hosts.
Sampling interval: Select the sampling interval for the statistics here. A more frequent sampling interval results in more precise graphs at the cost of heavier system load. The default setting is 5 minutes. The possible parameters are 5 minutes, 10 minutes, 30 minutes, 60 minutes, 2 hours, 4 hours, 8 hours, 1 day.
|
|
Caution:
Hazard of data loss When changing the Sampling interval, the already existing statistics are not converted to the new sampling rate, but are deleted. |
To clear all statistics, click Clear all statistics. It is advised to clear statistics if you have changed the number of the statistics files to keep, or if you have disabled the time-based statistics collection.
Reports
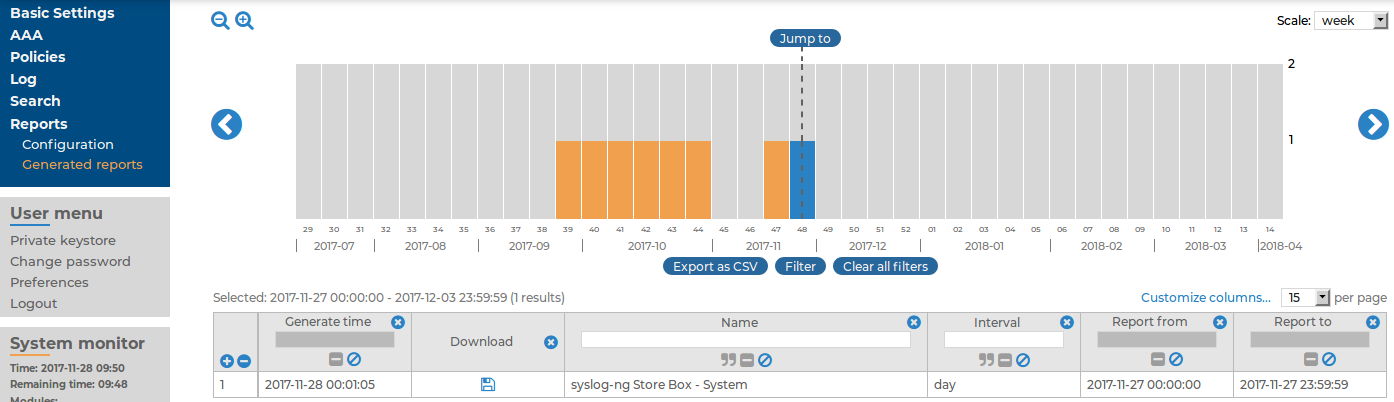
The syslog-ng Store Box (SSB) appliance periodically creates reports on the activity of the administrators, the system-health information of SSB, as well as the processed traffic. These reports are available in PDF format by selecting Reports > Generated reports from the Main menu. The reports are also sent to the email address set at Basic Settings > Management > Mail settings > Send reports to, unless specified otherwise in the configuration of the report.
To access the reports from the SSB web interface, the user must have the appropriate privileges.
NOTE: If the Basic Settings > Management > Mail settings > Send reports to address is not set, the report is sent to the SSB administrator's email address.
Figure 236: Reports > Generated reports — Browsing reports
Reports are generated as follows:
-
Daily reports are generated every day at 00:01.
-
Weekly reports are generated every week on Monday at 00:01.
-
Monthly reports are generated on the first day of every month at 00:01.
TIP: Use the time bar to find reports that apply a particular period. If you select a period (for example, click on a bar), only those reports will be displayed that contain information about the selected period.
The following information is available about the reports:
-
Download: A link to download the report.
-
Name: The name of the report.
-
Interval: The length of the reported period, for example, week, month, and so on.
-
Report from: The start of the reported interval.
-
Report to: The end of the reported interval.
-
Generate time: The date when the report was created.
TIP: To create a report for the current day, select Generate reports for today. The report will contain data for the 00:00 - current time interval. If artificial ignorance (for details, see Classifying messages with pattern databases) is enabled, an artificial ignorance report is created as well.
For details on how to navigate around the user interface and interact with features such as filtering and exporting results, and customizing what data is displayed, see Using the internal search interfaces.
