Chat now with support
Chat with Support

syslog-ng Store Box 7.3.0 - Administration Guide

Preface Introduction The concepts of SSB The Welcome Wizard and the first login Basic settings User management and access control Managing SSB Configuring message sources Storing messages on SSB Forwarding messages from SSB Log paths: routing and processing messages Configuring syslog-ng options Searching log messages Searching the internal messages of SSB Classifying messages with pattern databases The SSB RPC API Monitoring SSB Troubleshooting SSB Security checklist for configuring SSB Glossary

Performance-related settings

When configuring your Splunk destination for syslog-ng Store Box (SSB), you have to configure the performance-related settings after you finish configuring the JSON message body settings for the Splunk destination.

Figure 191: Log > Destinations > <your-splunk-destination> - Configuring the Performance-related settings for your new Splunk destination

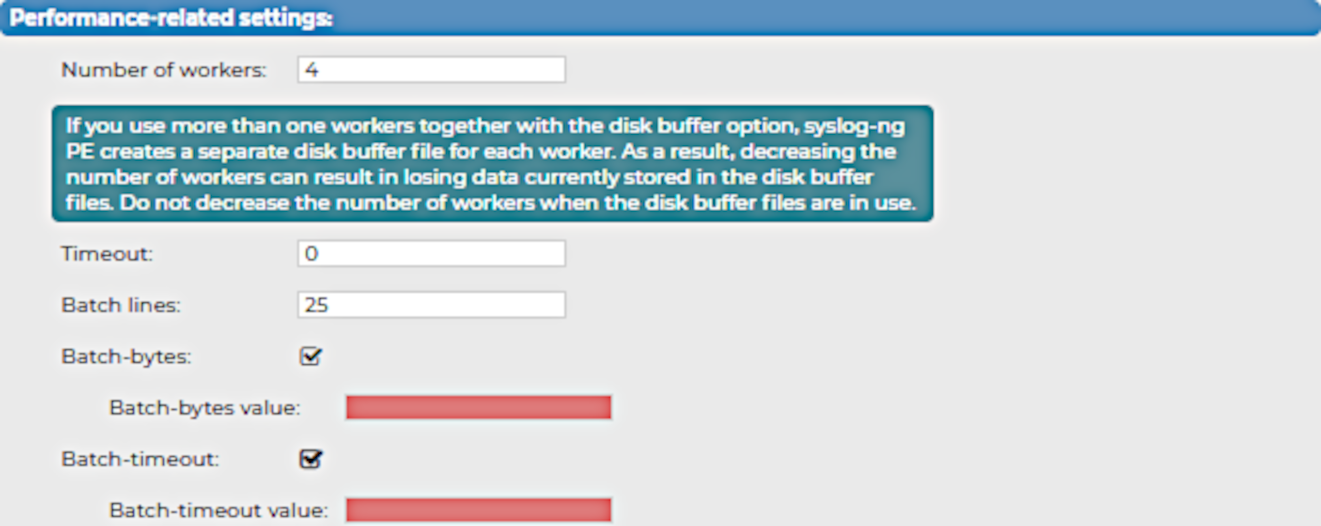
To configure the performance-related settings for your Splunk destination

  1. Specify the Number of workers that you want SSB to use when sending messages to the server.

    CAUTION: Hazard of data loss!

    When you use more than one worker threads together with disk-buffering enabled, consider that the syslog-ng PE application behind SSB creates a separate disk-buffer file for each worker thread. This means that decreasing the number of workers can result in losing data currently stored in the disk-buffer files. To avoid data loss, One Identity recommends that you do not decrease the number of workers when the disk-buffer files are in use.

    NOTE: Increasing the number of worker threads can drastically improve the performance of the destination.

  2. Specify the Timeout (in seconds) that you want SSB to wait for an operation to complete, and attempt to reconnect the server if the configured timeout limit is exceeded.

  3. In the Batch lines field, specify how many lines you want SSB to flush to a destination in one batch.

    NOTE: SSB waits for the configured number of lines to accumulate, and when this number is reached, SSB sends the message lines to the destination in a single batch. For example, if you set Batch lines to 100, SSB waits for 100 message lines before sending them in one batch.

    Consider the following when configuring the number of batch lines:

    • Increasing the number of batch lines increases throughput (because more messages are sent in a single batch), but also increases message latency.

    • If Batch-timeout option is disabled, the syslog-ng PE application behind SSB flushes the messages if it has sent the number of messages specified in Batch lines, or the queue became empty. If you stop or reload the syslog-ng PE application behind SSB, or if in case of network sources, the connection with the client is closed, the syslog-ng PE application behind SSB automatically sends the unsent messages to the destination.

    • If the Batch-timeout option is enabled and the queue becomes empty, SSB flushes the messages only if Batch timeout expires, or the batch reaches the limit set in Batch lines.

      NOTE: Depending on your source configuration settings, your batch may not reach the Batch lines limit before your queue becomes empty, and SSB forwards your messages.

  4. (Optional) Select Batch-bytes, and in the Batch-bytes value field, set the maximum size of payload in a batch (in bytes).

    NOTE: When configuring Batch-bytes, consider the following:

    • If the size of the messages reaches this value, the syslog-ng PE application behind SSB sends the batch to your Splunk deployment even if the number of messages is less than the value you configure in the Batch-bytes field.

    • Consider that if Batch-timeout is enabled and the queue becomes empty, SSB flushes the messages only if Batch-timeout value expires, or if the message batch reaches the limit set in the Batch-bytes field.

  5. (Optional) Select Batch-timeout, and in the Batch-timeout value field, specify the time SSB waits for Batch lines to accumulate in the output buffer.

    SSB sends batches to the destinations evenly. The timer starts when the first message arrives to the buffer, so if only few messages arrive, SSB sends messages to the destination once every Batch timeout milliseconds at most.

Forwarding log messages to HDFS destinations

You can forward log messages from syslog-ng Store Box(SSB) to Hadoop Distributed File System (HDFS) servers, allowing you to store your log data on a distributed, scalable file system. This is especially useful if you have huge amounts of log messages that would be difficult to store otherwise, or if you want to process your messages using Hadoop tools.

Forwarding log messages from SSB to an HDFS destination comprises the following steps:

  1. Configure a Kerberos policy.
  2. Configure the HDFS cluster.
  3. Configure an HDFS destination.
  4. Create a log path.

Configuring a Kerberos policy

The syslog-ng Store Box(SSB) appliance authenticates to the HDFS cluster through a trusted third party, a Kerberos server. Once SSB has been granted a ticket by Kerberos, it is then able to write data to the HDFS servers.

To configure a Kerberos policy

  1. Navigate to Policies > Kerberos and select to create a new policy.

  2. In the Default realm field, enter the name of the Kerberos realm where your SSB resides.

  3. If you have to specify the address of the Key Distribution Center (KDC) server, click (Add row) first, then enter the FQDN or IP address of the KDC server that is issuing tickets within your Kerberos realm.

    If your DNS server is configured to map Kerberos realms to KDC hostnames, you do not need to specify KDC servers here.

  4. Add a Kerberos principal policy. First, select 
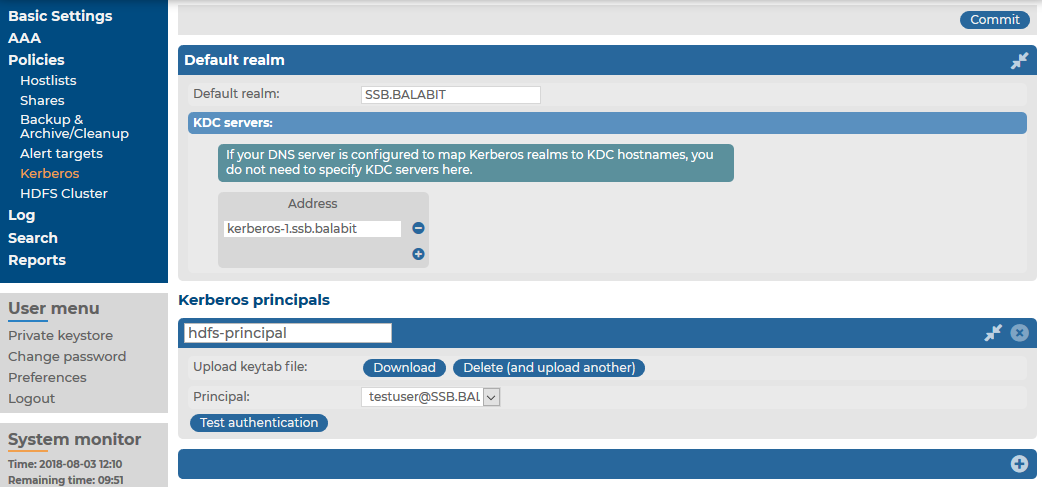
under Kerberos principals.

  5. Enter a name for your policy. This name will be used later on the Policies > HDFS Cluster page of SSB to identify the Kerberos principal policy you want to use. For more information, see Configuring the HDFS cluster.

  6. Upload the keytab file that contains keys for your principal.

    This is the principal that has write access to the HDFS cluster.

    The keytab file was provided to you by the Kerberos administrator, and it contains the encrypted key required to authenticate your principal to Kerberos.

  7. Select your principal from the Principal list.

    The keytab file you have uploaded may contain keys for several principals. This list displays all the principals with keys in the uploaded keytab file.

  8. Test if your principal can authenticate to Kerberos. To do so, click Test authentication.

  9. If everything works correctly, click .

    Figure 192: Policies > Kerberos — Configuring a Kerberos policy

Configuring the HDFS cluster

The following describes how to configure settings related to the HDFS cluster where you want to forward logs.

Prerequisites:

To configure settings related to the HDFS cluster where you want to forward logs

  1. Navigate to Policies > HDFS Cluster and select Enabled.

  2. Select the Kerberos principal policy configured previously (for details, see Configuring a Kerberos policy).

  3. Upload the Core site XML file of your HDFS cluster. You may have to ask for this file from your HDFS cluster administrator.

  4. Upload the HDFS site XML file of your HDFS cluster. You may have to ask for this file from your HDFS cluster administrator.

  5. In the Hadoop library archive field, upload the Hadoop binary tarball matching the version of your HDFS cluster infrastructure. Binary tarballs are distributed on the official Apache site.
  6. In the Hadoop library signature field, upload the signature GPG file matching the used binary version. Signature GPG files are distributed on the official Apache site.
  7. Click .

    The version number of the Hadoop library archive appears.

    Figure 193: Policies > HDFS Cluster — Configuring the HDFS cluster

Related Documents

The document was helpful.

Select Rating

I easily found the information I needed.

Select Rating