
Status history and statistics
SPS displays various statistics and status history of system data and performance on the dashboard at Basic Settings > Dashboard. The dashboard is essentially an extension of the system monitor: the system monitor displays only the current values, while the dashboard creates graphs and statistics of the system parameters.
The dashboard consists of different modules. Every module displays the history of a system parameter for the current day. To display the graph for a longer period (last week, last month, or last year), select the Week, Month, or Year options, respectively. Hovering the mouse over a module enlarges the graph and displays the color code used on the graph.
All types of data is collected every five minutes. This means that if changes are more frequent, it might not be represented in the graphs.
|
|
NOTE:
If all parameters displayed are 0 at a certain point in time, it might mean that at that time One Identity Safeguard for Privileged Sessions (SPS) was not functional (for example, turned off or unresponsive). Or, in certain cases it might also mean that there was no information at that time. |

|
|
NOTE:
If you want to compare data displayed on the Dashboard to data displayed on the System Monitor, they might be different, because data on System Monitor is based on SNMP values, whereas data on the related Dashboard modules are based on the output of different commands. |
To display statistics of a module as a table for the selected period, click on the graph.
Figure 286: Basic Settings > Dashboard — The dashboard
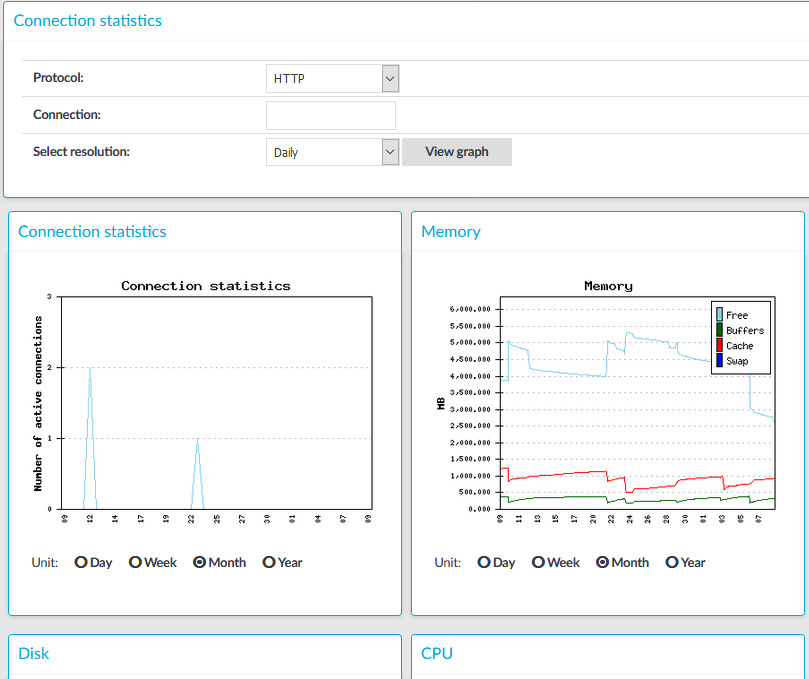
The following modules are displayed on the dashboard of SPS:
-
Connection statistics: Number of active connections per protocol.
-
Memory: The memory used by the system.
-
Disk: Filesystem usage for the different partitions.
-
CPU: CPU usage.
-
Network connections: Number of network connections.
-
Physical interface 1 (eth0): Traffic on physical interface 1.
-
Physical interface 2 (eth1): Traffic on physical interface 2.
-
Physical interface 3 (eth2): Traffic on physical interface 3.
-
Load average: Average load of the system.
-
Number of processes: The number of running processes.
Connection statistics
Figure 287: Basic Settings > Dashboard > Connection statistics
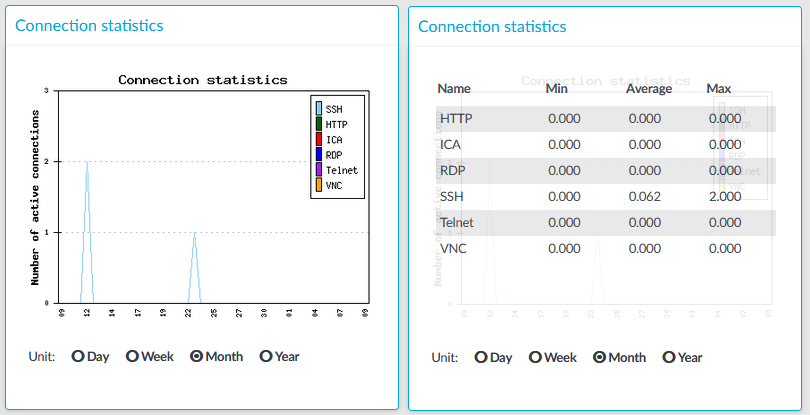
The Connection statistics module on the Dashboard is based on statistics of high-level proxy-service protocols (SSH, RDP, VNC, ICA, and so on). These numbers display all active high-level proxy-service protocols, but these numbers are counted by all service connections too, which are connected to some protocols. Because of this, these numbers can differ from the numbers displayed on the Active Connections page.
For example, if there are several active ICA connections in your system, it means that there are approximately the same number of CGP connections that are opened and counted in the Connection statistics module under the ICA label. If these CGP or ICA high-level proxy-service protocols are opening more than one TCP connections, these connections will be counted in the Network connetion module as different TCP connections, but these will count as only one connection on the Active Connections page.
Statistics
The connection types displayed can be the following:
-
RDP: The number of RDP connections.
-
SSH:The number of SSH connections.
-
HTTP: The number of HTTP connections.
-
ICA: The number of Citrix connections.
-
Telnet: The number of Telnet connections.
-
VNC: The number of VNC connections.
The Min, Average and Max values are displayed as a whole number if the value is constant for the statistics interval (the statistics are stored every 5 minutes). If minor changes occur in the actual values (for example, new connections are established), these changes can be displayed as fractions.
Memory
Figure 288: Basic Settings > Dashboard > Memory
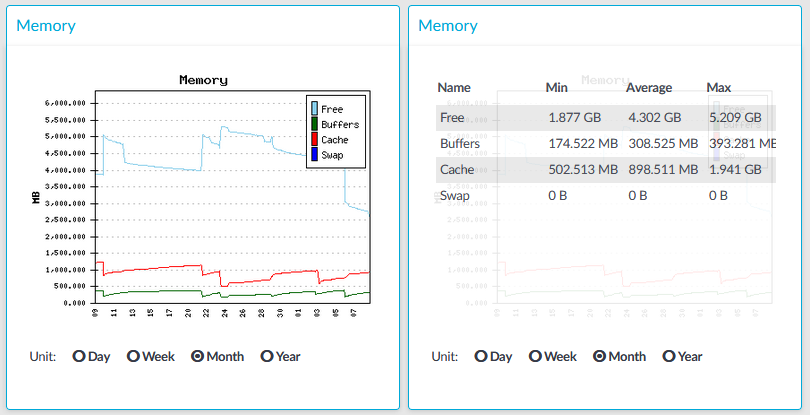
The Memory module on the Dashboard is based on data provided by the Linux kernel (/proc and /sys directories). The standard Munin plugins query this information from these locations and they are displayed on the GUI.
Statistics
The memory types displayed are the following:
-
Free: Free memory
-
Buffers: In-memory block I/O buffers.
-
Cache: Memory used for disk caching. This does not count as "used" memory, because it is freed when it is required.
-
Swap: Swap space usage (memory contents that have been temporarily moved to disk).This value might be high in case of lack of memory.
Disk
Figure 289: Basic Settings > Dashboard > Disk
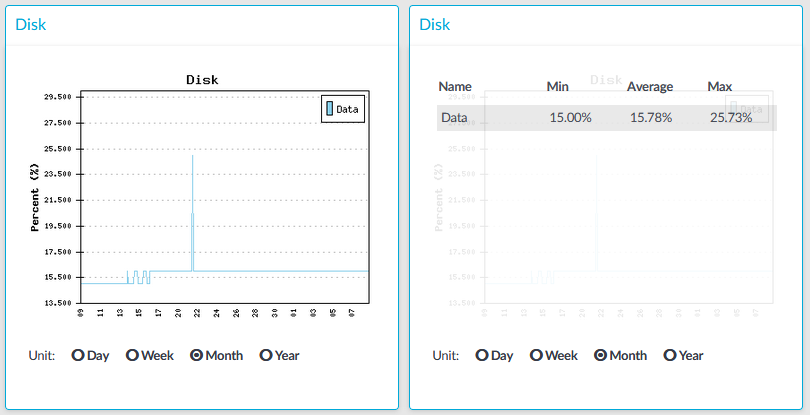
The Disk module on the Dashboard is based on the output of the df command.
Statistics
The information displayed is the following:
-
Data: The percent of disk that the core firmware uses.